VAS share price history: What caused the biggest ups and downs?

How has the Vanguard Australian Shares Index ETF performed over the past decade?

| More on:

You’re reading a free article with opinions that may differ from The Motley Fool’s Premium Investing Services. Become a Motley Fool member today to get instant access to our top analyst recommendations, in-depth research, investing resources, and more. Learn More

The Vanguard Australian Shares Index ETF (ASX: VAS) has a rather special place in the eyes of Australian investors, if the data is anything to go by. As we've covered on the Fool before, VAS is the ASX exchange-traded fund (ETF) that is the most popular amongst Australian investors.

As it stands today, this ETF has approximately $8.8 billion in funds under management (FUM), more than any other ASX ETF.

If you didn't know, VAS is an index fund. It covers the largest 300 companies on the ASX by market capitalisation, tracking the S&P/ASX 300 Index (INDEXASX: XKO).

This includes everything from Woolworths Group Ltd (ASX: WOW), Telstra Corporation Ltd (ASX: TLS) and Commonwealth Bank of Australia (ASX: CBA) to Afterpay Ltd (ASX: APT), JB Hi-F Ltd (ASX: JBH) and Ampol Ltd (ASX: ALD).

But what is the share price history of VAS? What have been its biggest ebbs and flows over the past decade? Well, to answer that question, let's first go through this ETF's performance figures.

What is the VAS ETF's past performance like?

So over the past 12 months (as of 31 July), VAS has returned a very healthy 29.11%. Over the past 3 years on average, VAS has returned 9.7% per annum.

It's very similar over the past 5 and 20 years, where VAS has returned an average of 10.08% per annum and 9.75% per annum respectively. These numbers include the impact of dividend returns as well which, considering VAS is a market-wide ASX ETF, are substantial.

But let's put this all in some visual context. Here is a graph of this ETF's performance over the past 10 years:

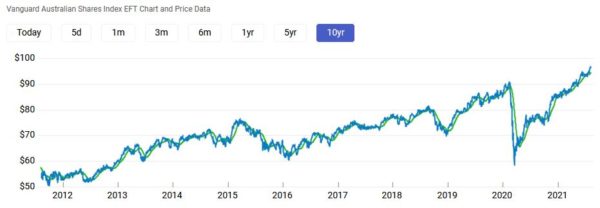
As you can see, there have been a few bumps and bruises over the past 10 years, but overall it has been a story of appreciation.

The largest dip occurred last year, during the coronavirus-induced share market crash which hit global markets in February and March 2020. Peak to trough, VAS lost approximately 32% of its value between 20 February and 20 March 2020.

But we all know how that ended up playing out. From late March onwards, the Australian share market staged a remarkable recovery, which of course was also captured by this ETF. Between March 2020 and today, VAS has appreciated by roughly 57%.

Before 2020, we saw some far more minor bumps and dips. The malaise that the markets went through back in 2015 is plain to see here, as is the short-but-sharp dip the markets experienced in late 2018.

Perhaps what is most evident though is how the more one zooms out, the less these dips seem to matter.

Motley Fool contributor Sebastian Bowen owns shares of Telstra Corporation Limited. The Motley Fool Australia's parent company Motley Fool Holdings Inc. owns shares of and has recommended AFTERPAY T FPO. The Motley Fool Australia owns shares of and has recommended AFTERPAY T FPO and Telstra Corporation Limited. The Motley Fool has a disclosure policy. This article contains general investment advice only (under AFSL 400691). Authorised by Bruce Jackson.

More on ETFs

A man in a suit smiles at the yellow piggy bank he holds in his hand.
ETFs

Is this outperforming ETF from Macquarie a strong buy?

Not all ETFs are passive. This Macquarie fund uses a data-driven approach to try and outperform global markets.

Read more »

Smiling attractive caucasian supervisor in grey suit and with white helmet on head holding tablet while standing in a power plant.
ETFs

ASX ETFs holding up amidst global volatility 

Why are these funds rising?

Read more »

A woman stands in a field and raises her arms to welcome a golden sunset.
ETFs

What is HALO investing and how do investors gain exposure to it?

Here's what investors need to know about the HALO framework.

Read more »

Woman smiling with her hands behind her back on her couch, symbolising passive income.
ETFs

3 of the best ASX ETFs for income investors

Blend them wisely to build resilient, lower-risk income.

Read more »

Smiling man sits in front of a graph on computer while using his mobile phone.
ETFs

3 ASX ETFs I'd buy for when the market rebounds

If markets recover from here, growth-focused ETFs could lead the way. These are 3 I’d be watching closely.

Read more »

ETF with different images around it on top of a tablet.
ETFs

Where to invest $50,000 in ASX ETFs for the next 10 years

Let's see why these funds could be worth holding tight to for the long term.

Read more »

a man weraing a suit sits nervously at his laptop computer biting into his clenched hand with nerves, and perhaps fear.
ETFs

Should investors be targeting growth or value ASX ETFs right now?

With markets reacting with volatility, where should investors turn?

Read more »

Smiling woman with her head and arm on a desk holding $100 notes, symbolising dividends.
ETFs

How much passive income could $100,000 in ETFs generate?

Income-focused ETFs offer different yields and structures. Here’s how much $100,000 could generate in annual passive income.

Read more »