This article was originally published on Fool.com. All figures quoted in US dollars unless otherwise stated.
You probably don't need the reminder, but this has been an abysmal year for Wall Street professionals and everyday investors, alike. Since hitting their all-time highs between mid-November 2021 and the first couple of days of January, the ageless Dow Jones Industrial Average (DJINDICES: ^DJI), benchmark S&P 500 (SNPINDEX: ^GSPC), and growth-driven Nasdaq Composite (NASDAQINDEX: ^IXIC) have respectively plummeted by as much as 22%, 28%, and 38%. That put all three -- at least briefly in the case of the Dow Jones -- firmly in a bear market.
Over the past six weeks (or a bit longer for the Dow), all three indexes have given optimists a reprieve. In fact, the Dow Jones is now considerably closer to an all-time high than a fresh year-to-date low. But in spite of this bounce, one billionaire money manager is sounding the warning on Wall Street.
This highly successful billionaire's actions speak louder than words
Approximately two weeks ago on Nov. 14, money managers and wealthy individuals with more than $100 million in assets under management were required to file Form 13F with the Securities and Exchange Commission. A 13F provides a snapshot of what the brightest minds on Wall Street held in their portfolios at the end of the most recent quarter. It also sheds light on what they've been buying and selling.
The standout 13F for the third quarter wasn't Berkshire Hathaway's Warren Buffett. Rather, it was billionaire hedge-fund manager David Tepper of Appaloosa Management. Tepper, who owns the NFL's Carolina Panthers franchise, is estimated to be worth $18.5 billion, making him one of the world's richest people.
Based on Appaloosa's 13F filing, the fund ended the third quarter with stakes in 22 securities. Tepper's hedge fund completely sold out of eight holdings and reduced its stake in another 12 remaining positions.
Meanwhile, Tepper didn't buy one share of a single stock or warrant in the September-ended quarter. That's $1.36 billion in assets under management and not one penny deployed to buy equities at a seemingly reduced valuation.
In an October interview with CNBC, Tepper was asked whether he liked the risk-versus-reward for stocks, given the current interest-rate environment. Tepper bluntly replied, "I don't think there's any great asset classes right now." He also went on to claim:
I don't love stocks. I don't love bonds. I don't love junk bonds.
Although Tepper echoed Buffett's sentiment that stocks are a great tool for long-term wealth building, he was quite clear nothing appears attractive, given interest-rate uncertainty, for the time being.
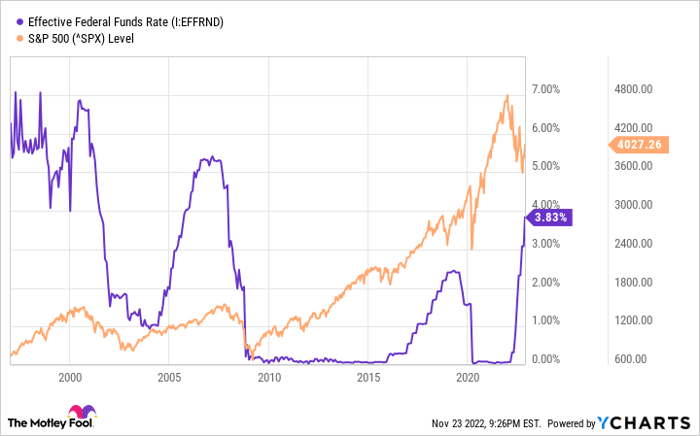
Effective Federal Funds Rate data by YCharts.
A multitude of metrics suggest the stock market will head lower
Tepper's very clear warning for Wall Street jives with a number of metrics and historic data points that would seem to suggest the broader market has yet to hit bottom. For example, Federal Reserve monetary policy has, to some degree, foretold market bottoms -- but probably not in the way you might think.
Whereas a lot of investors are looking forward to an eventual Fed "pivot" and easing of interest rates, bear markets over the past quarter of a century show that stock market bottoms tend to occur well after rate-easing begins. Following the beginning of rate-easing cycles during the dot-com bubble (2001), financial crisis (2007), and prior to the COVID-19 pandemic (2019), it respectively took 645 calendar days, 538 calendar days, and 236 calendar days for the S&P 500 to bottom. This would suggest there's a long way to go until stocks find their trough.
A couple of valuation-based metrics spell trouble for Wall Street, as well.
The S&P 500 Shiller price-to-earnings (P/E) ratio (also known as the cyclically adjusted price-to-earnings ratio, or CAPE ratio) is front and center on the warning list. All five instances where the S&P Shiller P/E has crossed above 30 during a bull market rally since 1870 have eventually resulted in a decline of at least 20% for the S&P 500. Further, over the past 25 years, the S&P Shiller P/E ratio has bottomed out during most corrections and bear markets around 22. The Shiller P/E was 29.5, as of Nov. 23, 2022.
The S&P 500's forward-year P/E ratio is another concern. With the exception of the Great Recession, the broad-based index has bottomed with a forward P/E of 13 to 14 on numerous occasions since 1995. Its forward P/E on November 23 was 17.5.
Even outstanding margin debt, which I've previously expounded on in greater detail, suggests the bear market bottom isn't in.
Take Tepper's advice... all of it
If this multitude of metrics and historic data points are accurate, the short-term pain for investors may well extend into 2023 and validate David Tepper's cautious tone. But it's important to digest everything Tepper had to say about the stock market in his interview with CNBC.
Even though the successful billionaire was clear with both his actions and words that there's nothing worth buying at the moment, he noted on multiple occasions the value of buying equities for the long term. This bit of sage advice has never been wrong -- at least when examining the major indexes.
According to data provided by sell-side consultancy firm Yardeni Research, there have been 39 separate declines of at least 10% in the S&P 500 since the beginning of 1950. Every single last one of these crashes, corrections, and bear markets were eventually cleared away by a bull market rally. This holds true for the Dow Jones Industrial Average and Nasdaq Composite, too.
What's more, timing the stock market has proved far less important than how much time you spend in the market. A study by Crestmont Research found that if an investor were to have hypothetically purchased an S&P 500 tracking index at any point from 1900 onwards and held that position for at least 20 years, they would have generated a positive total return, including dividends paid, every single time! Crestmont found that the rolling 20-year total returns averaged 10.9% or higher on an annual basis in more than 40% of the 103 ending years it examined (1919 through 2021).
In other words, even though things appear bleak now, it's as good a time as any to put your money to work if you have a long-term mindset and companies on your radar that are continuing to execute their strategies and visions.
This article was originally published on Fool.com. All figures quoted in US dollars unless otherwise stated.