This article was originally published on Fool.com. All figures quoted in US dollars unless otherwise stated.
If there's a perfect word to sum up the first six months of 2022 for the investing community, I believe it's "Yuck!" As of the closing bell on June 30, 2022, the U.S. stock market delivered its worst first-half return in 52 years.
Since hitting their respective all-time closing highs between mid-November and the first week of January, the widely followed Dow Jones Industrial Average (DJINDICES: ^DJI), broad-based S&P 500 (SNPINDEX: ^GSPC), and growth-stock-driven Nasdaq Composite (NASDAQINDEX: ^IXIC), respectively plunged by as much as 19%, 24%, and 34%. You'll note these figures firmly entrench the S&P 500 and Nasdaq in a bear market, with the iconic Dow Jones just one bad day away from joining its peers.
But the big question on the minds of Wall Street professionals and investors is very simply, "How far could the stock market fall?" The answer may lie with two key indicators.
Valuation comes into focus during bear market declines
When the benchmark S&P 500 falls into a bear market, it's not uncommon for equities to experience multiple compression. In other words, price-to-earnings (P/E) ratios, price-to-sales ratios, and so on, decline to reflect a general wave of pessimism throughout the investing landscape and broader economy.
What you might not realize is that this pessimism has resulted in the S&P 500's forward-year P/E ratio falling into a similar range during significant pullbacks. During the coronavirus crash in the first quarter of 2020, the fourth-quarter pullback of 2018, and the end of the dot-com bubble in 2002, the S&P 500's forward P/E bottomed out between 13 and 14 each time.
As of the end of June 2022, the S&P 500's forward P/E ratio stood at 15.8. If the S&P 500's forward P/E ratio were simply to fall to the median of its historic pullback range (i.e., 13.5), the index would decline by an additional 14.55% from where it closed on Thursday, June 30. This would imply a bottom of around 3,235 on the S&P 500.
Of course, this calculation only holds merit if the "e" component, earnings, doesn't change. With the nation's central bank rapidly increasing interest rates to bring historically high inflation under control, there's a high likelihood that corporate earnings revisions are in the offing.
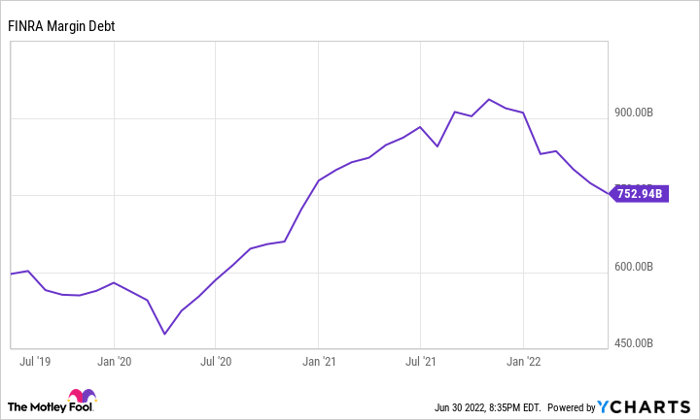
FINRA Margin Debt data by YCharts.
Margin debt is an ominous indicator for the broader market
The other key indicator that can be helpful in identifying how much further the stock market could plunge is outstanding margin debt. Margin debt being the amount of money borrowed from brokerages by investors, with interest, to purchase or short-sell securities.
As a general rule, it's perfectly normal for the amount of outstanding margin debt to grow in-step with the aggregate value of the equity markets over time. What sounds the warning bells is when margin debt skyrockets over a short period. History has shown time and again that rapid increases in risk-taking end poorly.
Since the beginning of 1995, there have been three instances where margin debt increased by 60% or more in a 12-month period. It first occurred between March 1999 and March 2000, and pretty much marked the top of the dot-com bubble. The ensuing bear market was the longest on record (929 calendar days) and wiped out nearly half of the S&P 500's value.
It next occurred between June 2006 and June 2007, which was just a few months prior to the financial crisis taking shape. The S&P 500 shed 57% of its value by the time March 2009 rolled around.
Lastly, margin debt soared again between March 2020 and March 2021. If history serves as a guide, the S&P 500 could lose half its value. This would put the bottom a long way off at around 2,400.
Patience pays off handsomely
According to these two indicators, which have proved fairly accurate over the past quarter of a century, the S&P 500 is unlikely to find a bottom until somewhere between 2,400 and 3,235. For context, it ended the first half of 2022 at 3,785.
However, no indicator is foolproof. If there was a surefire index or indicator that told investors when to buy, we'd all be using it by now to get rich.
While the prospect of additional downside in the near-term might be unnerving to some investors, I'd again point to history as your guide. That's because every single stock market crash, correction, and bear market throughout history (excluding the current bear market) has eventually been cleared away by a bull market rally. In short, it pays to be both patient and optimistic.
With the Nasdaq and S&P 500 in bear market territory, and the Dow Jones mired in a steep correction, now is the ideal time for long-term investors to put their money to work.
Arguably one of the smartest investing strategies to employ when market volatility picks up is dollar-cost averaging. Dollar-cost averaging involves putting your money to work at specific time intervals, regardless of where a stock happens to be trading. It's a great way to remove some of the emotional aspects of investing in a down market.
A plunging stock market is also an excellent time to buy dividend stocks. Publicly traded companies that regularly pay a dividend are usually profitable and time-tested. Having navigated tough times before, these are just the type of companies we'd expect to increase in value over long stretches.
The point being that now is not the time to run for cover. Rather, it's the time to consider putting some of your available cash, which won't be needed for bills or emergencies, to work.
This article was originally published on Fool.com. All figures quoted in US dollars unless otherwise stated.