This article was originally published on Fool.com. All figures quoted in US dollars unless otherwise stated.
Most investors are able to keep their focus on a particular company's proverbial "bigger picture." Sure, the occasional unexpected headline might distract and buffet a stock every now and then, but for the most part, the market has a knack for evaluating a company and pricing shares at appropriate, risk-adjusted levels. The hard part sometimes is understanding what the financial metrics are really saying.
An investor can listen to some of the data being explained and easily get what it's trying to say, but there are some ideas that are just easier to understand in pictures than they are in words. The financial metrics regarding consumer technology giant Apple Inc. (NASDAQ: AAPL) are no exception to this reality.
Here are five financial "pictures" that will visually help any investor gain a better understanding of where this tech company is, and where it seems to be going.
1. For better or worse, Apple is a Western company
Apple's CEO Tim Cook has always been bullish on China as a big growth driver for the company, even since 2017 when the iPhone's sales tanked in that particular market. Much to the delight of shareholders, China's consumers became interested in its wares again by the end of that year.
The fact of the matter is that the other side of the planet remains a much more important market for Apple right now. The Americas alone account for nearly half of Apple's business, while Europe makes up about a fourth of the company's top line.
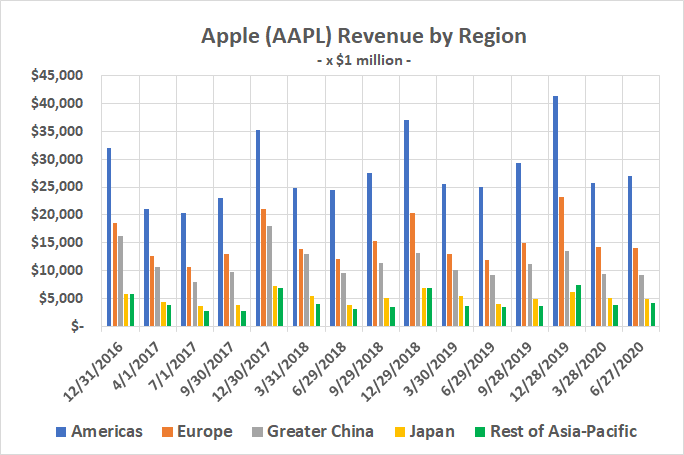
Data source: Apple quarterly reports. Chart by author.
Of course, Europe and the Americas are a relatively bigger deal now than they were then, largely because China and the rest of Asia still aren't exactly growing for Apple.
2. Services growth is offsetting the iPhone headwind
Apple may have stopped reporting the number of iPhones it sells as of early 2019, but a close look at its quarterly results since then reminds us the company never stopped reporting total iPhone revenue. That may be the more important figure of the two, especially given Apple's deliberate development of its services arm that reflects app and media revenue.
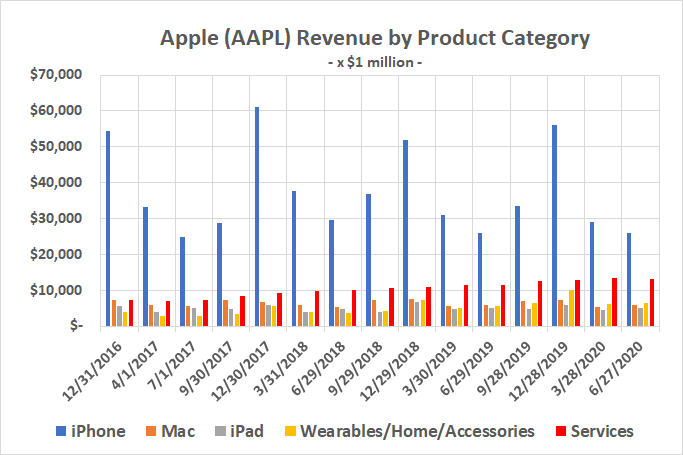
Data source: Apple quarterly reports. Chart by author.
To this end, notice how services revenue has pretty much offset any headwinds related to saturation of the smartphone market, and now accounts for roughly one-fifth of the company's total business. That's ultimately a function of how many iPhones are still in active use, and not necessarily tethered to new phone sales.
3. Big operating margins for services
Sales of physical products like Macintosh computers and the iPhone may contribute more to the bottom line, but not as much as those product revenues might suggest. The operating margins on digital goods and services (revenue minus the costs associated with offering apps, videos, music, etc.) is more than twice the profit margin percentages of hardware. Although they only make up around one-fifth of Apple's sales, services drive about one-third of the company's operating earnings.

Data source: Apple quarterly reports. Chart by author.
4. Heavy cash flows easily fund the dividend, and more
Ergo, the steady revenue and income production of digital services, in conjunction with its consistently marketable iPhone, makes Apple a cash-generating machine even in more challenging environments. Notice that cash flow easily covers the amount of earnings the company's been dishing out in the form of dividends.
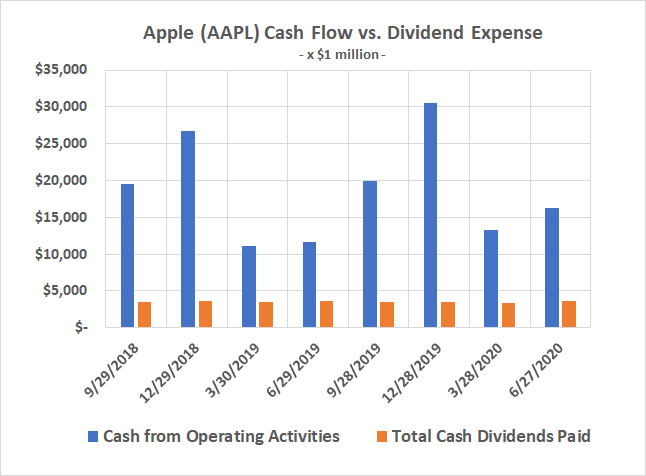
Data source: Thomson Reuters Eikon. Chart by author.
5. More revenue and earnings growth in store
And where's it all going? Analysts are modeling more of the same growth into the future, anticipating a strong rebound next year out of this year's lull. Respectable single-digit sales growth is in the cards for 2022, which mirrors the pace established before the COVID-19 pandemic took hold.
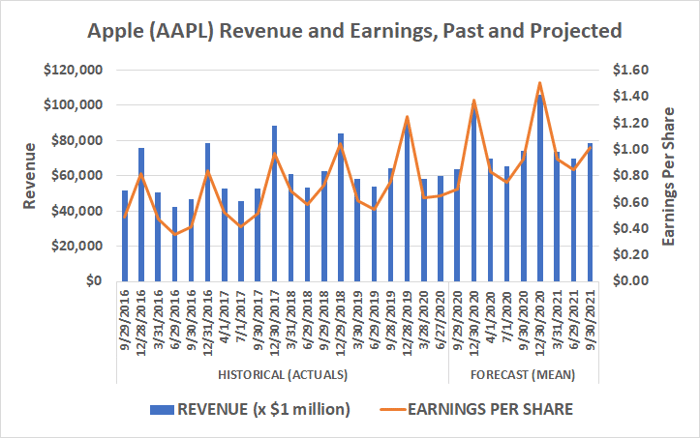
Data source: Thomson Reuters Eikon. Chart by author.
Per-share earnings are expected to grow at an even faster clip, thanks to continued stock buybacks that mathematically make each share more profitable, by reducing the total number of them. Of course, this has long been the case for Apple.
This article was originally published on Fool.com. All figures quoted in US dollars unless otherwise stated.