
Image source: Getty Images
What is EPS?
An acronym for earnings per share, EPS indicates how much profit per share a company returns to shareholders. We calculate EPS by dividing a company's profit or net income by the number of outstanding shares.
It's an important concept to understand because it is also used in several other ways to evaluate an ASX company's appeal for investment. A related metric is the price-to-earnings (PE) ratio, which we'll discuss later.
How to calculate EPS
The EPS formula is as follows:
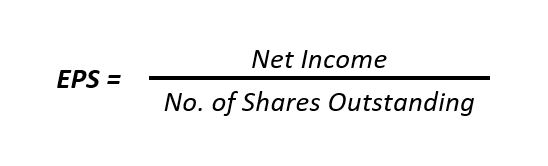
It's worth noting here that the EPS calculation does not usually use the EBITDA metric, which stands for earnings before interest, taxes, depreciation, and amortisation.
We mention this because EBITDA is a common substitute for 'earnings' in other contexts. However, calculating a company's EPS typically uses net income, including the costs listed above that the EBITDA metric discards.
You'll come across companies in your research with no EPS value. They have yet to turn a profit, so their EPS is effectively zero (or even a negative number). This doesn't mean the company is broke or bankrupt! It usually means they're in the growth stage and focused on maximising revenue over profit.
Basic vs diluted EPS
When analysing a company, investors like to look at two types of EPS numbers: Basic and diluted EPS.
They are similar in that they both use the above formula for calculation. However, there is one significant difference.
Basic EPS considers all shares currently outstanding, as per the formula above. Diluted EPS does the same but adds any stocks the company might have quarantined for items such as share options, warrants, or shares allocated to management or employees as part of their remuneration.
The diluted earnings metric assumes that all these shares are issued per the formula below.
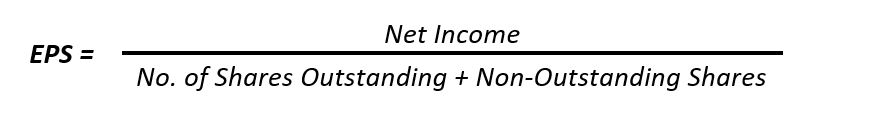
As such, the diluted EPS number will typically be lower than the basic EPS number due to including these 'unissued' shares in the overall share count. Many investors prefer the diluted EPS metric, where applicable, as it is more conservative and considers more potential outcomes.
What's the difference between EPS and adjusted EPS?
Yet another measure of EPS that investors may consider in their investment analysis is adjusted EPS. Adjusted EPS divides a company's net income by the total number of outstanding shares but modifies the net income figure by excluding certain items deemed non-recurring, unusual, or unrelated to normal business operations. These items might include one-time charges, restructuring costs, write-offs, or gains from sales of assets.
Adjusted EPS aims to clarify a company's ongoing operational performance by filtering out noise and anomalies that can skew the basic EPS. It's handy for assessing the company's core business performance and making more accurate comparisons across periods or with other firms in the industry.
While basic EPS is more standardised and easier to calculate, adjusted EPS offers a nuanced view tailored to give a more realistic picture of the company's operational health.
However, it's essential to exercise caution with adjusted EPS, as adjustments are subject to discretion and can vary significantly between companies. Investors should carefully examine what specific adjustments have been made and why to ensure a proper understanding of a company's financial performance.
Why is measuring EPS important?
When analysing an ASX company for potential investment, most investors look at the annual EPS recorded and how it has changed over time.
As EPS effectively measures how much profit a company returns to its owners (investors), it shows past performance.
If a company has been growing its EPS at a healthy rate in recent years, it usually indicates that it will continue to do so. A higher EPS can mean the company has the potential to be a successful investment.
Conversely, if a company's EPS has been going backwards in recent years, that's usually a red flag.
Sometimes, a company can justify a falling EPS by extraordinary circumstances, so you must research further to discover why.
What is a good EPS?
Determining what constitutes a 'good' EPS is a nuanced undertaking. The allure of EPS lies in its apparent simplicity – it measures a company's profitability on a per-share basis. But declaring an EPS as 'good' requires context.
A good EPS is generally one that shows profitability and indicates positive trends when compared to the company's past performance and future potential. It's not just about the raw numbers; it's about the story they tell. For instance, a consistently increasing EPS over several quarters or years can signify robust and sustainable growth.
We must weigh any EPS figure against the broader market and industry benchmarks. A higher EPS can suggest better profitability and efficiency when comparing companies within the same industry.
But what constitutes a good EPS in one sector might be mediocre in another. For example, technology companies often have higher EPS benchmarks than manufacturing firms due to their differing market dynamics and growth potential.
Investors should consider the P/E ratio alongside EPS. A high EPS paired with an excessively high P/E ratio might suggest overvaluation. A moderate EPS with a lower P/E ratio could indicate an undervalued stock with growth potential.
A good EPS is not just about high numbers but about how those numbers align with the company's valuation, industry standards, and growth trajectory.
What are the metric's limitations?
While EPS is a widely used barometer for assessing a company's profitability, it has limitations. The primary issue with EPS lies in its simplicity, which can mask underlying complexities.
One significant limitation is that EPS does not account for the capital needed to generate the earnings. Two companies could have the same EPS, but one might achieve it with far less investment, indicating a more efficient use of capital.
EPS is also vulnerable to manipulation through financial engineering. Companies can artificially inflate their EPS through strategies like share buybacks, reducing the number of outstanding shares to boost EPS without an actual increase in earnings. It means a higher EPS doesn't always equate to better company performance or healthier financials.
Another limitation is that EPS does not consider the debt a company holds. A heavily debt-laden company can still show a favourable EPS, obscuring the risks associated with its financial obligations.
Further, the metric – especially basic EPS – doesn't factor in the effects of convertible securities, which can significantly dilute earnings when converted into shares.
Finally, EPS ignores the price of a stock — it doesn't indicate whether the share is overvalued or undervalued. Investors should look at EPS with other financial metrics and ratios to better understand a company's financial health and market valuation. The narrative EPS tells is undoubtedly valuable, but it's just one chapter in the broader financial story.
Other uses of earnings per share
Investors and analysts also use EPS to calculate additional common ASX shares investing metrics, such as the PE ratio we touched on earlier.
The PE ratio measures a company's share price relative to its earnings per share. It's an excellent metric for comparing companies in the same industry or sector.
For example, if a mining company's PE ratio is 15 and the mining industry's PE ratio is 20, it might indicate the company is a good buy at its current share price.
Dividend investors, in particular, will be familiar with the payout ratio. This ratio measures how much a company's earnings are paid in dividends each year. For example, if a company's EPS is $2 and it pays out $1 per share in dividends, it will have a payout ratio of 50%.
- Additional reporting: Kate O'Brien
Frequently Asked Questions
-
Determining what qualifies as a 'good' EPS is an exercise in context and comparison. A good EPS is one that not only indicates profitability but also shows strength relative to past performance, sector standards, and prospects. EPS values vary widely across different industries. For example, technology companies traditionally have higher EPS figures than those in more capital-intensive industries like manufacturing. Therefore, a good EPS for a stock in one industry might be considered average or even below par in another.
A good EPS is often determined in light of a company's growth trajectory and stability. A steadily increasing EPS over several quarters or years can signal robust and sustainable growth. But it's essential to look beyond the number itself. High EPS figures can be misleading – if they result from one-off events or financial maneuvers like share buybacks, they can artificially inflate the EPS.
-
A higher EPS number may suggest better performance, but the truth is more nuanced. At its core, a higher EPS indicates that a company is generating greater profits per share of stock. This is attractive to investors as it points to a company's ability to generate profits and pay dividends. However, determining whether a higher EPS is genuinely 'better' depends on several additional factors.
It's crucial to consider how the company achieves a higher EPS. If it's a result of genuine growth in profitability and operational efficiency, then it's typically a positive indicator. However, if the higher EPS is due to accounting adjustments, share buybacks, or other non-operational activities, it might not reflect an actual improvement in fundamental performance.
The context of industry and market conditions is critical. A high EPS might be the norm in some sectors and not necessarily indicate exceptional performance. Additionally, a higher EPS should be evaluated with the company's share price, as reflected in the P/E ratio. A high EPS with an excessively high P/E ratio might suggest overvaluation. Therefore, while a higher EPS can be a favourable sign, it should be interpreted in the context of the company's overall financial situation and the market context.
-
EPS offers a window into a company's profitability, condensed into a simple per-share figure. It's a metric that tells you how much of a company's profit is assigned to each share of stock. At its most basic level, a higher EPS indicates more profit per share, which shows an improved ability to generate earnings and provide shareholder dividends.
By comparing the EPS figures over time, investors can track a company's growth trajectory, gaining insights into historical and potential future performance. Comparing EPS figures from companies within the same industry can also help investors assess a company's competitiveness in the sector. It's essential, however, to consider EPS alongside other financial metrics to form a holistic view of a company's health. Understanding the context behind an EPS figure – whether it's driven by operational success or influenced by financial engineering like share buybacks – is crucial.
