
This article was originally published on Fool.com. All figures quoted in US dollars unless otherwise stated.
This week, Donald Trump took the oath of office and a new era began for Wall Street.
Following his victory in November, the broader market was propelled higher, with financial stocks surging on the prospect of less oversight.
Additionally, many of the stock market's most influential businesses have jumped on the belief that Trump will target another round of corporate income tax rate cuts — at least for businesses that make their products in America. After the Tax Cuts and Jobs Act was signed into law by Trump in December 2017, stock buyback activity for S&P 500 (SP: .INX) companies soared.
Investors are also excited about the prospect of a repeat performance. During Trump's first term in the White House, the ageless Dow Jones Industrial Average (DJX: .DJI), benchmark S&P 500, and growth-powered Nasdaq Composite (NASDAQ: .IXIC) galloped higher by 57%, 70%, and 142%, respectively.
While Wall Street has been given plenty of reason to be excited about President Donald Trump's second term, he's also making ominous stock market history — and it should have investors concerned.
President Trump officially makes dubious stock market history
Among the dozens of presidents that have preceded Trump in the Oval Office, none can say they've inherited a pricier stock market.
The most common way to measure "value" on Wall Street is with the price-to-earnings (P/E) ratio. The P/E ratio is arrived at by dividing a company's share price into its trailing-12-month earnings per share (EPS), with a lower P/E ratio typically signifying a better value.
Though the P/E ratio is a fantastic tool for quickly assessing the relative cheapness or priciness of a mature business, it can be easily tripped up by short-term shock events that disrupt corporate earnings. For example, lockdowns during the COVID-19 pandemic in 2020 made trailing-12-month EPS relatively useless for a number of companies.
This is where the S&P 500's Shiller P/E Ratio comes into play. You'll commonly find the Shiller P/E Ratio also referred to as the cyclically adjusted P/E Ratio (CAPE Ratio).
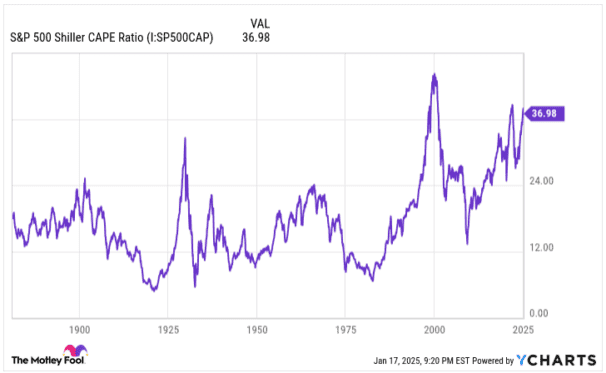
S&P 500 Shiller CAPE Ratio data by YCharts.
The Shiller P/E is based on average inflation-adjusted EPS over the prior 10 years. Using a decade of inflation-adjusted earnings history means that shock events can't skew this valuation metric. In other words, it provides as close to an apples-to-apples valuation measure as possible when back-tested more than 150 years.
As of the closing bell on January 17, the S&P 500's Shiller P/E sat at 38.11. This marks the highest reading for an incoming president dating back to January 1871 (i.e., as far back as the Shiller P/E can be back-tested). For context, the average Shiller P/E over the last 154 years is 17.19.
What's particularly concerning is what's happened during previous instances where stock valuations became extended to the upside.
Since 1871, there have only been six instances where the Shiller P/E has surpassed 30 during a bull market, including the present. Following the prior five occurrences, the Dow Jones, S&P 500, and/or Nasdaq Composite all shed 20% to 89% of their value. Although the timing of these peak-to-trough downturns has been unpredictable, the crystal-clear takeaway is that premium valuations aren't sustainable.
Even with most of President Donald Trump's policies viewed as favourable to corporate America, inheriting one of the priciest stock markets in history might pave the way for a bear market or short-lived crash during his second term.
History offers a silver lining for investors, too
Based solely on what history tells us, premium valuations for stocks aren't sustainable over very long periods. Eventually, the stock market is going to enter a period of correction and the Shiller P/E will retrace from one of its highest readings in history.
But it's not all bad news for investors — it just depends on your investment time frame.
In June 2023, the researchers at Bespoke Investment Group published a data set on social media platform X that compared the calendar-day length of every bear and bull market for the S&P 500 dating back to the start of the Great Depression in September 1929.
As you can in the post below, there were 27 separate bear and bull markets spanning 94 years. Whereas the typical bear market stuck around for only 286 calendar days, the average bull market endured for 1,011 calendar days, which is about 3.5 times as long.
This isn't the only evidence that suggests widening your investment lens and playing the long game is a winning approach.
Every year, Crestmont Research refreshes a published data set that calculates the 20-year rolling total returns (including dividends paid) for the S&P 500 dating back to 1900. Despite the S&P not coming into existence until 1923, Crestmont was able to track the performance of its components in other indexes from 1900 to 1923 to gather back-tested total return data.
Out of 105 rolling 20-year periods examined, with end years of 1919 through 2023, all 105 generated positive total returns. No matter what challenges Wall Street contended with, hypothetically buying and holding an S&P 500 tracking index for 20 years has been a profitable investment 100% of the time since the start of the 20th century.
What's more, investor returns were often sizable. Approximately 90% of these rolling 20-year periods generated an average annual total return of 6% or greater, while nearly half of all ending years produced annualised returns of at least 9%.
President Donald Trump making stock market history may serve as an ominous short-term warning for investors, but the long-term upward trajectory for equities remains firmly intact.
This article was originally published on Fool.com. All figures quoted in US dollars unless otherwise stated.