This article was originally published on Fool.com. All figures quoted in US dollars unless otherwise stated.
Though you probably don't need the reminder, it's been an abysmal year for professional and everyday investors alike. Since hitting their respective all-time highs between mid-November and the first week of January, the iconic Dow Jones Industrial Average (DJINDICES: ^DJI), benchmark S&P 500 (SNPINDEX: ^GSPC), and growth-dependent Nasdaq Composite (NASDAQINDEX: ^IXIC) have plunged by as much as 22%, 26%, and 34%, through Oct. 10, 2022, and are firmly in the grips of a bear market.
Regardless of whether you're a tenured or new investor, bear markets can be scary. The velocity and unpredictability of moves lower are enough to make investors question their willingness to stick around. Of course, history also shows that buying during these bear market dips is the smartest thing patient investors can do.
The thing is, the stock market might not be anywhere near a bottom.
This risk-focused indicator portends new lows for the stock market
To be fair, if there were an indicator that perfectly called stock market corrections and bear markets, as well as market bottoms, everyone would be using it by now. There simply isn't an indicator that can accurately predict where the stock market will move next 100% of the time.
However, there are a handful of indicators with impressive track records. Select valuation-based indicators portend the S&P 500, Dow Jones, and Nasdaq will ultimately head lower. But it's an oft-overlooked risk indicator -- outstanding margin debt -- that could really tell the tale of where the broader market heads next.
"Margin debt" describes the amount of money investors have borrowed from their broker, with interest, to buy or short-sell securities. Although some trading activity requires the use of margin, such as short-selling, most outstanding margin debt is viewed as a snapshot of risk tolerance. In other words, margin is usually used as a tool to increase leverage or exposure to a security or the broader market.
Over time, it's perfectly normal for the amount of outstanding margin debt to increase in lockstep with the overall value of the stock market. What isn't normal is when the amount of outstanding margin debt skyrockets over a short time frame.
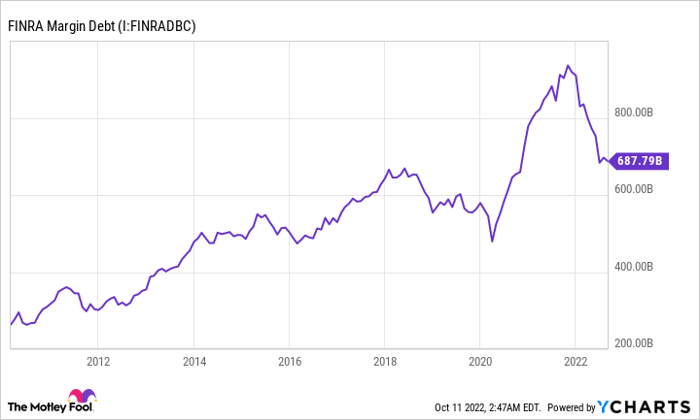
FINRA Margin Debt data by YCharts.
Since the beginning of 1995, there have been three instances where margin debt surged 60% or more on a trailing-12-month (TTM) basis. This happened immediately prior to the dot-com bubble bursting, just months before the financial crisis took shape, and in March of last year. Upward percentage spikes in margin debt have preceded three of the past four bear markets (the one-month coronavirus crash being the exception).
Not only has outstanding margin debt been a good predictor of an eventual bear market, but it's done a good job of forecasting bear market bottoms. When the dot-com bubble and financial crisis found their respective troughs, TTM declines in margin debt ranged between 40% and 50%. Current TTM declines in margin debt are only down a little over 20%. The implication is that we'd need to see additional unwinding of margin-based positions before a true market bottom is in place.
For added context, the S&P 500 subsequently lost 49% and 57% of its respective value the previous two times margin debt skyrocketed by 60% or more in a 12-month stretch. It's lost a peak of "just" 26% of its value in 2022.
Here's why you're smart to buy stocks during bear market declines
But the interesting thing about peril on Wall Street is that it also breeds opportunity. For investors, there's been no greater ally than time.
If you were to bet on which direction the stock market would head over the next 12 months, your chance of being correct is around 50%. But if your bet spans multiple decades, your chance of being correct goes way up.
Every year, market analytics company Crestmont Research publishes data on the rolling 20-year total returns, including dividends paid, of the S&P 500 and expresses this data as an average annual total return. Crestmont has done this for 103 ending years (1919-2021). For example, if you wanted to know the rolling 20-year total return for 1939, Crestmont would factor in the total returns for years 1920 through 1939 and express it as an annual average total return.
Here's the interesting part: Out of the 103 end years examined, every single one -- I repeat, every single one -- produced a positive average annual total return over 20 years. No matter when you bought an S&P 500 tracking index since the beginning of 1900, you made money as long as you held onto that position for 20 years.
Something else worth pointing out is that most folks would have made quite a bit of money. You can count on one hand the number of end years that produced an average annual total return of between 3.1% and 5%. By comparison, approximately 40% of these 103 end years delivered an average annual total return ranging from 10.9% to 17.1%.
In case you need even more evidence that being patient and optimistic is a winning strategy, consider this: The average double-digit percentage correction in the S&P 500 since the beginning of 1950 has lasted just 189 calendar days or about six months. Although we're dealing with a longer bear market decline at the moment, history conclusively shows that bull markets last disproportionately longer than corrections.
Eventually, this bear market will share the same fate as others before it and be placed in the rearview mirror by a bull market rally.
This article was originally published on Fool.com. All figures quoted in US dollars unless otherwise stated.