
Image source: Getty Images
What is the Phillips Curve?
The Phillips Curve illustrates the inverse relationship between the rate of inflation and the rate of unemployment within an economy. This economic model suggests that higher inflation is associated with lower unemployment and vice versa, at least over the short term.
The idea behind the Phillips Curve is simple: As employment falls, the demand for workers increases. Wages will go up since employers need to pay more to attract workers. When wages go up, inflation follows.
The model suggests that the inverse is true. In times of higher unemployment, there's less need for companies to pay premium wages, so costs — and inflation — are tamped down.
The Phillips Curve implies that there is a trade-off between inflation and unemployment, suggesting that policymakers could potentially reduce unemployment in the short run by accepting higher inflation rates.
However, the long-term applicability and validity of the Phillips Curve have been the subject of debate, especially after the 1970s when many economies experienced stagflation (high inflation and high unemployment simultaneously).
Many economists now believe the Phillips Curve is a useful tool, but only in the short term.
Why is the Phillips Curve important?
Before the 1970s, policymakers used the Phillips Curve to monitor the money supply and control inflation. If unemployment rose above a target rate, central bankers such as the Reserve Bank of Australia (RBA) would lower interest rates to encourage more spending and hiring. If unemployment fell, bankers could increase rates to keep inflation under control.
Actions by the RBA have major implications for your investments. When inflation is high, for example, and central bankers boost interest rates, it may cost companies more to borrow. Wage costs may also rise to ensure members of a well-trained workforce don't seek greener pastures.
And, when unemployment is low, some investments — such as simple bank accounts or certificates of deposit — may be less attractive. As we saw during the COVID-19 pandemic, low unemployment can present its own set of problems for corporations since supply chain issues prevent them from acquiring goods and materials in a timely manner.
Using the Phillips Curve
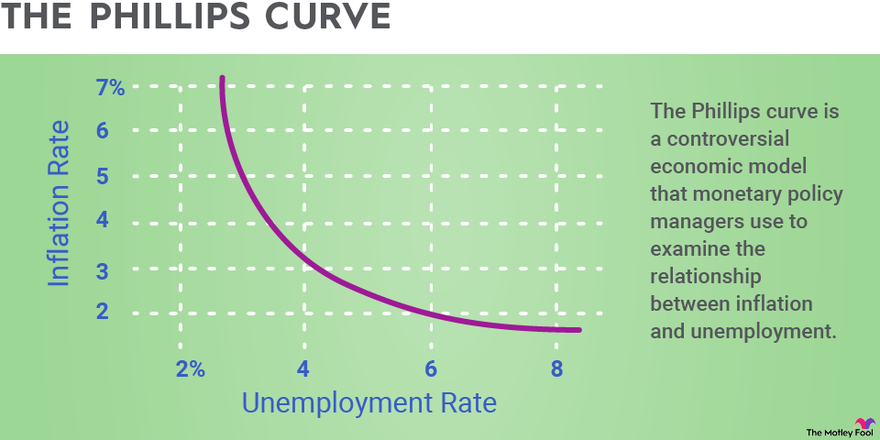
The Phillips Curve features the unemployment rate on the horizontal axis and the inflation rate on the vertical axis. A straight vertical line is drawn on the horizontal axis for the natural unemployment rate. In the United States, this number is set at 4.4% by the Congressional Budget Office.
In Australia, this is known as the non-accelerating inflation rate of unemployment (NAIRU), which provides an estimate of the degree of labour market slack in the economy. According to a 2021 Treasury working paper, the NAIRU was estimated between 4.5 and 5 per cent immediately prior to the COVID-19 recession.1
If the economy is in a recession, the unemployment rate will be higher than the natural unemployment rate. This means the Phillips Curve will be to the right of the straight vertical line. As the economy recovers, the curve will move farther to the right if a higher level of inflation is predicted.
Is it useful for investors?
The Phillips Curve can be useful information for investors, but only to a degree. Since the 1980s, It has gone through two decades of flattening, meaning changes in unemployment have a less pronounced effect on inflation than they did in earlier decades.
One of the key shortcomings of the Phillips Curve is the assumption that inflation is only associated with a single country's unemployment rate — a concept that has become outdated in a globalised economy.
Yet it's worth noting that when US inflation rose sharply in late 2022, it was followed by the nation's unemployment rate decreasing in January 2023 to its lowest level since May 1969.
Example of the Phillips Curve
Let's look at a basic example of the Phillips Curve. Say our inflation rate is 6%, and our natural unemployment rate is 4%. We can draw a vertical line from the horizontal (unemployment) axis and a horizontal line from the vertical (inflation) axis.
The RBA might normally respond to this by raising interest rates to keep inflation from climbing higher, and that approach might work. But in this example — where the RBA tames inflation and it falls to 2% — unemployment rises to 7% because there's not as much demand for workers to produce more goods and services.
Again, there's no absolute guarantee that the economy will behave in ways that models show. As we've all learned, the economy has ways of surprising us.
And although the Phillips Curve may be useful for central bankers, investors should remember that it's a generalisation. Inflation will frequently lead to lower unemployment, but only over the short term.
As always, a buy-and-hold strategy best serves investors as it doesn't try to time the market or make short-term predictions about the future of the economy.
In today's economy, the Phillips Curve represents a more nuanced and debated concept than its original formulation suggested. While it historically depicted an inverse relationship between inflation and unemployment, contemporary analyses indicate that this relationship has flattened, especially since the 1980s.
Globalisation, technological advancements, changes in labour market dynamics, and the proactive stance of central banks in managing inflation expectations have all contributed to this transformation.
Nowadays, the Phillips Curve is viewed as a tool that can offer insights into the inflation-unemployment trade-off in the short term, but with a cautionary understanding of its limitations and the influence of global economic factors. Central banks continue to reference this model for policy-making but are increasingly aware of its complexities and the broader economic context.
The Phillips Curve can shift due to a variety of factors that influence the relationship between inflation and unemployment, reflecting changes in economic conditions, expectations, and external shocks.
One significant cause is the change in inflation expectations. When businesses and consumers anticipate higher inflation in the future, they adjust their wage demands and pricing strategies accordingly, which can lead to an actual increase in inflation independent of the current state of unemployment.
Supply shocks can also shift the Phillips Curve. Events such as sudden increases in oil prices, natural disasters, or geopolitical conflicts can lead to higher production costs, pushing inflation up even if the unemployment rate remains unchanged.
Global economic factors can moderate inflationary pressures domestically, leading to shifts in the Phillips Curve. The integration of global markets means that domestic inflation is less tied to domestic unemployment than it once was, as firms can source cheaper inputs from abroad and consumers can buy imported goods, both of which can keep inflation low despite low unemployment. Despite criticisms and the observation of a flattening relationship since the 1980s, the Phillips Curve remains a relevant concept in economic discussions and policy-making. Its relevance today is more nuanced, acknowledging that while the simple inverse relationship between inflation and unemployment might not hold as strongly as before, the underlying principles still offer valuable insights.
Economists and central banks utilise the model as a framework to understand potential trade-offs between inflation and unemployment, albeit with a critical approach that considers global economic integration, technological changes, and evolved monetary policy strategies. The Phillips Curve continues to inform discussions on economic policy, especially in short-term analyses, but it is now applied with a broader understanding of the complex dynamics at play in modern economies.Frequently Asked Questions
