A golden cross is a technical pattern where the short-term moving average of an asset or the overall stock market surpasses its long-term moving average. Investors often view the pattern as a sign that a security or the stock market has turned a corner into a bullish phase.
How a golden cross works
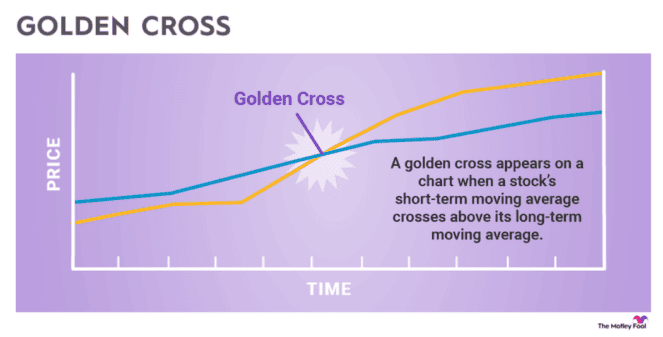
A golden cross is a bullish pattern in which a short-term moving average (typically 50 days) surges past a long-term moving average (typically 200 days), indicating positive upward momentum.
A moving average is the average price of a security over a specified period of time. Technical analysts often track patterns in moving averages and trading volumes to make buy and sell decisions.
The opposite of a golden cross is a death cross, which indicates a bearish trend. A death cross occurs when the short-term moving average of a security or the market drops below its long-term moving average.
The three stages
A golden cross has three basic stages:
- A downward trend – in which the short-term moving average is lower than the long-term moving average – begins to reverse. Buying volume begins to exceed selling volume.
- The short-term moving average crosses over the long-term moving average, creating the golden cross.
- The bullish trend is confirmed as the price continues to rise, and the short-term moving average remains higher than the long-term moving average.
While 50 days and 200 days are the typical periods for determining crossover patterns, some investors use shorter windows of time. For example, short-term traders may examine the 10-day and 50-day moving averages.
What a golden cross means for investors
Because a golden cross indicates a bullish trend, many investors hail it as a strong buy sign. Investors who have shorted stocks, essentially betting that the price will drop, may interpret this pattern as a sign that it's time to exit their positions because a bearish trend has ended.
However, not all investors view a golden cross as a reliable signal that a bull market is ahead. Like any stock chart pattern, a golden cross is a lagging indicator, which means it only tells you what's happened. It doesn't necessarily predict that positive momentum will continue. You'll only know in hindsight if the pattern observed was, in fact, part of a larger trend.
Sometimes a chart pattern can become a self-fulfilling prophecy, though. Many investors view a golden cross as a 'buy' signal. When a major index or asset reaches a golden cross, it triggers more buying, perpetuating the bullish pattern observed.
While it's possible to profit from short-term market trends, buy-and-hold investing and dollar-cost averaging have a far better track record of building wealth. The stock market has a better than 50% chance of being up on any given day. But in the long run, it has a pretty remarkable record of going up. By focusing on short-term patterns, like a golden cross or death cross, investors may miss out on the power of compounding over time.
Example of a golden cross
The S&P 500 Index (SP:.INX) formed a golden cross in early July 2020, roughly four months after the COVID-19 stock market meltdown. The golden cross is the point on the right side of the chart below where the purple and orange lines intersect.
The point where the purple and orange lines intersect on the left side of the chart represents a death cross. At that point, many US states were ending lockdowns, and there was growing optimism about the development of a COVID-19 vaccine.
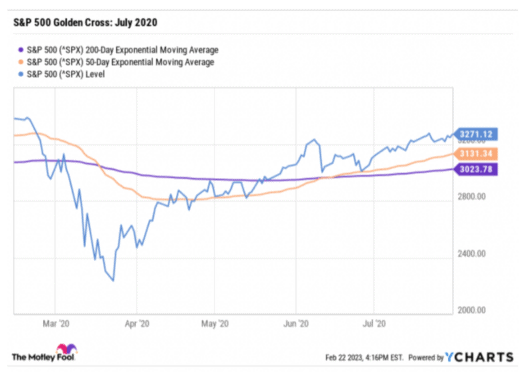
The S&P 500 index went on to make gains of more than 50% until early January 2022, when stocks began to tumble. Before that, the S&P 500 had formed a golden cross in April 2019. The index made gains of about 16% before stocks tanked in early 2020.
