The S&P 500 Index (SP: .INX) and Nasdaq Composite Index (NASDAQ: .IXIC) reached new all-time highs on Wall Street last night. It should be a cause for celebration. If only the record weren't accompanied by a more sinister number cracking into uncharted territory, too.
Warren Buffett and I both know investing is for the long term, and history has shown that more record highs follow record highs (eventually). And yet, the greatest of all time (GOAT) investor still takes heed of a market consumed by greed.
As it turns out, Warren's own indicator of an overvalued market also reached an all-time high overnight.

Image source: Getty Images
Warren Buffett's valuation ratio
Roughly 23 years ago, Warren Buffett explained what he considered to be "the best single measure" of valuations, whether overvalued or undervalued. While the world's tenth richest person has since walked back the importance of the measure, it remains a popular tool among investors.
The metric, aptly known as the 'Buffett Indicator', measures the total market capitalisation of US stocks divided by the country's gross domestic product (GDP). Essentially, it's a ratio of the valuation investors are willing to ascribe to public companies versus the actual size of the country's economy.

As shown in the chart above, the Warren Buffett Indicator is at a historical high of 195%. Before this rally, the previous high was 194.8%, set in November 2021. The S&P 500 began falling a month later, resulting in a 25% crash over the following nine months.
Why is it at the highest point in its history?
There is a dichotomy between the economy and the stock market, especially in the United States.
On the one hand, the United States economy is softening as interest rates eat into spending. At the same time, there's a seemingly insatiable demand for all things artificial intelligence (AI).
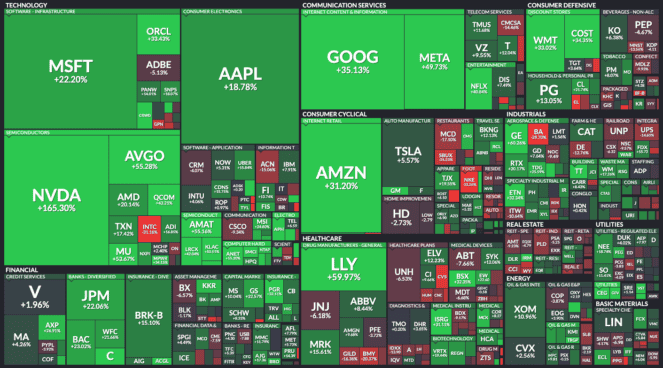
As a result, stock market indices are being pushed higher by a small handful of beneficiaries of the AI appetite — Nvidia Corp (NASDAQ: NVDA), Microsoft Corp (NASDAQ: MSFT), etc. These same companies constitute a large portion of the entire US stock market, as shown above.
The narrow concentration of growth could explain the record disconnect between the overall stock market and the United States economy.
What does it mean for investors?
As a strong critic of 'timing the market,' Warren Buffett doesn't dump his portfolio when the overall market looks frothy. Rather, he usually moves incoming cash from his investments in Berkshire Hathaway Inc. (NYSE: BRK) into U.S. Treasury Bills until he discovers an opportunity.
An 'overvalued' market hasn't stopped the Oracle from Omaha from finding stocks to buy. Filings show Buffett bought more shares in oil and gas giant Occidental Petroleum Corp (NYSE: OXY) last month. A company whose shares are only up 1.6% year-to-date.
It shows that the 'market' can be 'expensive', but a good investor can keep hunting. Instead of falling victim to FOMO (fear of missing out), Warren Buffett is zigging when others are zagging.