Here are 10 years of ASX 200 historical returns

We run the numbers over the past decade on the ASX 200…

| More on:
a young boy dressed in a business suit and wearing thick black glasses peers straight ahead while sitting at a heavy wooden desk with an old-fashioned calculator and adding machine while holding a pen over a large ledger book.

Image source: Getty Images

You’re reading a free article with opinions that may differ from The Motley Fool’s Premium Investing Services. Become a Motley Fool member today to get instant access to our top analyst recommendations, in-depth research, investing resources, and more. Learn More

In a year like 2022, it can be easy to lose track of the fact that, in most years, ASX shares go up and not down. This year has been a rough one for the S&P/ASX 200 Index (ASX: XJO).

Even after this week's rather spectacular gains, the index remains down by 3.4% year to date on today's numbers at present.

We are in December now, so it is still possible the ASX 200 ekes out a gain for the year. But it's probably going to be a squeaker.

Here at the Fool, it's turning into something of an annual tradition to take a look at the historical returns of the ASX 200 Index over the past decade.

Looking back on the kind of returns ASX shares have given investors over a long period of time can only be a good thing – and it shows just how little the year-to-year fluctuations of the markets can have on the long-term wealth of a prudent investor.

ASX 200 historical returns: 2012-2021

So without further ado, here are the returns of the ASX 200 over the past decade by calendar year. The data comes from S&P Global, the index provider responsible for running the ASX 200 Index. The returns include dividends paid as well:

YearReturn of ASX 200
201219.88%
201319.88%
20145.31%
20152.25%
201611.45%
201711.46%
2018(3.13%)
201923.02%
20201.18%
202116.97%

For those readers who love a good graph, fear not. Here is that same data in graph mode:

ASX 200 returns
ASX 200 10-year Returns | Chart: author's own | Data: S&P Global

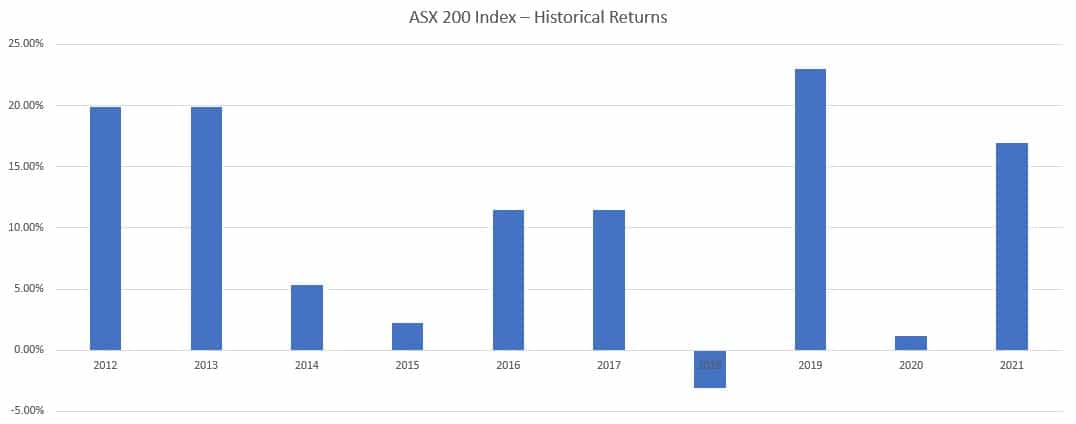
So this just goes to show exactly how lucrative owning shares can be on a long-term basis. Out of 10 years, just one year of negative returns. That could be two by the end of 2022, but we'll have to wait and see on that one.

Regardless, it is clear that buyers win far more often than sellers, and the ASX 200's trajectory over time is in an upward, if inconsistent, direction.

Time to address the elephant in the room, though. There are no typos in the above data. In a wild and mathematically unlikely coincidence, the returns in 2012 and 2013 are indeed both 19.88%. Ditto with the returns of 2016 and 2017, which are almost identical as well.

Motley Fool contributor Sebastian Bowen has no position in any of the stocks mentioned. The Motley Fool Australia's parent company Motley Fool Holdings Inc. has no position in any of the stocks mentioned. The Motley Fool Australia has no position in any of the stocks mentioned. The Motley Fool has a disclosure policy. This article contains general investment advice only (under AFSL 400691). Authorised by Scott Phillips.

More on Index investing

a business person in a suit and tie directs a pointed finger upwards with a graphic of a rising bar graph and an arrow heading upwards in line with the person's finger.
Index investing

BetaShares Nasdaq 100 ETF (NDQ) surges 7%: a reminder not to delay a good buying opportunity

Waiting for a bigger dip could cost you...

Read more »

ETF written on wooden blocks with a magnifying glass.
Index investing

Australian equities ASX ETFs set for record quarter

International turmoil has caused a surge in popularity for domestic equities ASX ETFs this quarter.

Read more »

Cubes placed on a Notebook with the letters "ETF" which stands for "Exchange traded funds".
ETFs

If I could only buy 1 ASX ETF, it would be this one

This ETF simply covers all bases...

Read more »

ETF written on wooden blocks with a magnifying glass.
ETFs

VAS vs VHY: Which is the better Vanguard ETF?

A higher yield isn't always the best choice.

Read more »

A woman looks questioning as she puts a coin into a piggy bank.
Index investing

The Vanguard US Total Market ETF (VTS) is down 8% from its peak. Is it time to buy?

Like many index funds, VTS is looking cheap right now.

Read more »

ETF written on wooden blocks with a magnifying glass.
ETFs

Meet the 2 new Vanguard ETFs that just hit the ASX

Vanguard has something for everyone with these new funds...

Read more »

A man casually dressed looks to the side in a pensive, thoughtful manner with one hand under his chin, holding a mobile phone in his hand while thinking about something.
Index investing

Vanguard Australian Shares ETF (VAS): Should we be worried about CBA?

Has CBA grown too big for VAS' boots?

Read more »

A businessman looking at his digital tablet or strategy planning in hotel conference lobby. He is happy at achieving financial goals.
Index investing

Is the Vanguard Australian Shares Index ETF (VAS) a buy at $105?

It can still be a good idea to buy index funds when they look expensive...

Read more »