Here are 10 years of ASX 200 historical returns

Here's a look at how the ASX 200 has performed over the past decade…

| More on:
a woman with a small satisfied smile on her face looks at reflected, illuminated data on screens in front of her.

Image source: Getty Images

You’re reading a free article with opinions that may differ from The Motley Fool’s Premium Investing Services. Become a Motley Fool member today to get instant access to our top analyst recommendations, in-depth research, investing resources, and more. Learn More

What kinds of historical returns does the S&P/ASX 200 Index (ASX: XJO) offer?

Most investors worth their salt will tell you that most of the money made on the ASX 200 (or any other) share market is made through combining compound interest with time. The great Warren Buffett is one of them. He once famously said that "the stock market is a device for transferring money from the impatient to the patient".

There's no better way of seeing this compounding in action than by looking at the past returns of a share market. Only then can one really appreciate the wonder of compound interest. We all worry about the next share market crash, but the boring-but-beautiful truth is that shares tend to go up far more often than they go down.

ASX 200 historical returns: 2011-2020

So let's take a look at the ASX 200's historical returns over the past ten years. These returns, courtesy of S&P Global, the company that runs the ASX 200 Index, include the benefits of dividends paid:

YearReturn of ASX 200
2011(10.84%)
201219.88%
201319.88%
20145.31%
20152.25%
201611.45%
201711.46%
2018(3.13%)
201923.02%
20201.18%

And here is that data in visual form:

ASX 200 10-year Returns | Chart: author's own | Data: S&P Global

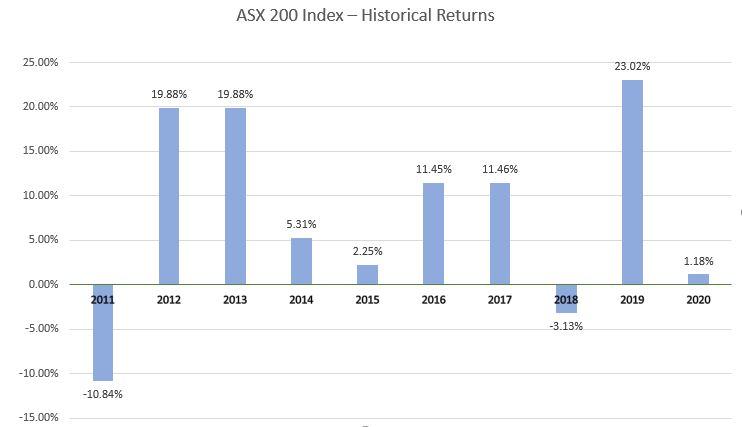
As you can see, it's been a lot more 'up' than 'down' over the past decade, albeit with the occasional bout of market volatility. It's especially fascinating to see that the index even managed to eke out a positive gain last year, even after the worst market crash in a decade.

As it stands today, the ASX 200 looks set to enjoy yet another positive year in 2021 (touch wood), seeing as the Index has managed to put on an additional 11.33% in 2021 so far. Although we still have two-and-a-bit months to go until the end of the year, one could say things are looking promising.

Motley Fool contributor Sebastian Bowen has no position in any of the stocks mentioned. The Motley Fool Australia's parent company Motley Fool Holdings Inc. has no position in any of the stocks mentioned. The Motley Fool Australia has no position in any of the stocks mentioned. The Motley Fool has a disclosure policy. This article contains general investment advice only (under AFSL 400691). Authorised by Bruce Jackson.

More on Share Market News

A man has a surprised and relieved expression on his face. as he raises his hands up to his face in response to the high fluctuations in the Galileo share price today
Broker Notes

These ASX 200 shares could rise 20% to 50%

Big returns could be on the cards for owners of these shares according to analysts.

Read more »

rising gold share price represented by a green arrow on piles of gold block
Share Gainers

Here are the top 10 ASX 200 shares today

It was a horrible way to end the trading week today for ASX investors.

Read more »

Piggy bank sinking in water symbolising a record low share price.
52-Week Lows

9 ASX 200 shares tumbling to 52-week lows today

Israel's strike on Iran on Friday dragged several ASX 200 shares to new depths.

Read more »

Female miner smiling at a mine site.
Share Gainers

Up 834% in a year, guess which ASX mining stock is hitting new all-time highs today

The ASX mining stock has gone from strength to strength over the past year.

Read more »

Broker written in white with a man drawing a yellow underline.
Broker Notes

Brokers name 3 ASX shares to buy now

Here's why brokers are feeling bullish about these three shares this week.

Read more »

A male investor wearing a blue shirt looks off to the side with a miffed look on his face as the share price declines.
Share Fallers

Why COG, Karoon Energy, Netwealth, and Pilbara Minerals shares are dropping today

These ASX shares are ending the week deep in the red. But why?

Read more »

Man drawing an upward line on a bar graph symbolising a rising share price.
Share Gainers

Why Fiducian Group, Northern Star, Paradigm, and Santos shares are charging higher

These shares are avoiding the market selloff.

Read more »

Dollar sign in yellow with a red falling arrow in front of a graph, symbolising a falling share price.
Share Market News

Why did the ASX 200 just sink to new 2-month lows on Friday?

It’s been a rocky week for the ASX 200. But why?

Read more »