Investors who have been around the proverbial block a few times might remember 'the Buffett indicator'. This is a market metric that has been made famous by the great investor Warren Buffett – hence the name.
It hasn't been thrown around too much over the past few years. Many investors even think it's outdated, or doesn't truly reflect the mechanics of the modern stock market. We should all hope that they are right because the Buffett indicator has never looked so dire for future investing returns.
But let's rewind. What exactly is the Buffett indicator?
The Buffett indicator is a simple metric that measures the market capitalisation of the entire US stock market against the gross national product (GNP) of the US economy. Put simply, it measures how values shares are compared with the broader economy.
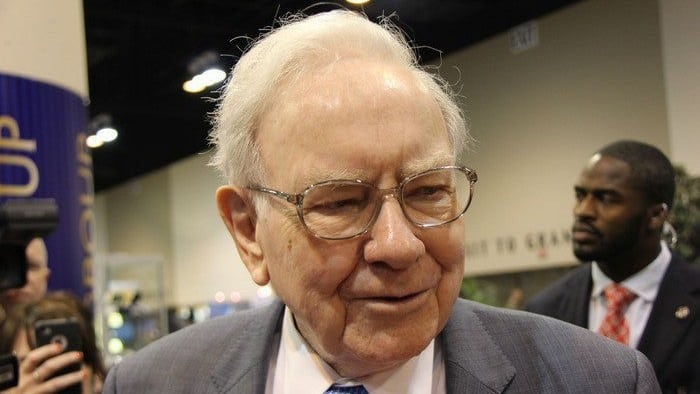
Image source: Getty Images
The Berkshire Hathaway way
Here's how Buffett explained it back in 1999:
[It] shows the market value of all publicly traded securities as a percentage of the country's business–that is, as a percentage of GNP. The ratio has certain limitations in telling you what you need to know. Still, it is probably the best single measure of where valuations stand at any given moment. And as you can see, nearly two years ago the ratio rose to an unprecedented level. That should have been a very strong warning signal.
For investors to gain wealth at a rate that exceeds the growth of U.S. business, the percentage relationship line on the chart must keep going up and up. If GNP is going to grow 5% a year and you want market values to go up 10%, then you need to have the line go straight off the top of the chart. That won't happen.
For me, the message of that chart is this: If the percentage relationship falls to the 70% or 80% area, buying stocks is likely to work very well for you. If the ratio approaches 200%–as it did in 1999 and a part of 2000–you are playing with fire. As you can see, the ratio was recently 133%.
So basically Buffett is saying that stock markets should grow in line with US GNP over time. If they exceed GNP, then the market is overvalued (like it turned out to be in 2000). If they undershoot GNP, the market is undervalued. Even though Buffett said that this method "has limitations", he also thought that "it is probably the best single measure of where valuations stand at any given moment". Well, at least he did in 1999. Buffett hasn't said too much on it since this interview.
How is the Buffett indicator looking today?
As implied earlier, the Buffett indicator today does not paint a rosy picture. According to currentmarketvaluation.com, US GNP is standing at US$21.9 trillion, as of 22 April. But the value of the US markets is sitting at US$51.3 trillion. That means that the Buffett indicator is flashing red at 234% – meaning that US stocks are worth 234% more than the country's GNP. That's the highest the indicator has ever been, including where it was at the peak of the dot-com bubble back in the early 2000s (when Buffett made the above remarks).
Of course, many investors aren't too worried. There's a lot that has changed since 1999 when Buffett outlined his position on this indicator. Back then, the US's largest companies were stocks like Exxon Mobil Corporation (NYSE: XOM) and General Electric Company (NYSE: GE). Now they are companies like Amazon.com, Inc. (NASDAQ: AMZN), and Alphabet Inc (NASDAQ: GOOG)(NASDAQ: GOOGL). And US companies have far more global reach than they used to. Software-as-a-Service business models have made them more profitable than ever. And let's not forget that interest rates have never been as low as they are today. That is certainly playing a role in the current market valuations.
But who knows, maybe we'll be looking back in a decade and think 'how did no one see the dangers of the Buffett indicator'? Or maybe everyone will have forgotten this rather unique ratio by then. Time will tell!