Here are 10 years of ASX 200 historical returns

Ever wondered what kinds of returns the S&P/ASX 200 Index (ASX: XJO) offers over 10 years? Well, here's your answer, along with my thoughts.

| More on:
$100 notes multiplying into the future representing asx growth shares

Image source: Getty Images

You’re reading a free article with opinions that may differ from The Motley Fool’s Premium Investing Services. Become a Motley Fool member today to get instant access to our top analyst recommendations, in-depth research, investing resources, and more. Learn More

What kinds of historical returns does the S&P/ASX 200 Index (ASX: XJO) offer?

We Fools routinely implore our readers to consider investing in ASX 200 shares. The sharemarket has historically been one of the greatest wealth creation engines you could have put your money in. But many would-be investors still worry about investing in shares – anxious about the inherent volatility that walks hand-in-hand with share market wealth creation. While it's true that ASX 200 shares have their bad years (some dramatically bad), the real story here is that, most years, shares go up, enriching those who own them. And even in the market's bad years, there is still the comfort of receiving dividends from many stocks.

But enough preaching, I'll put my money where my mouth is and look at 10 years of historical returns for the ASX 200 index.

10 years of ASX 200 historical returns

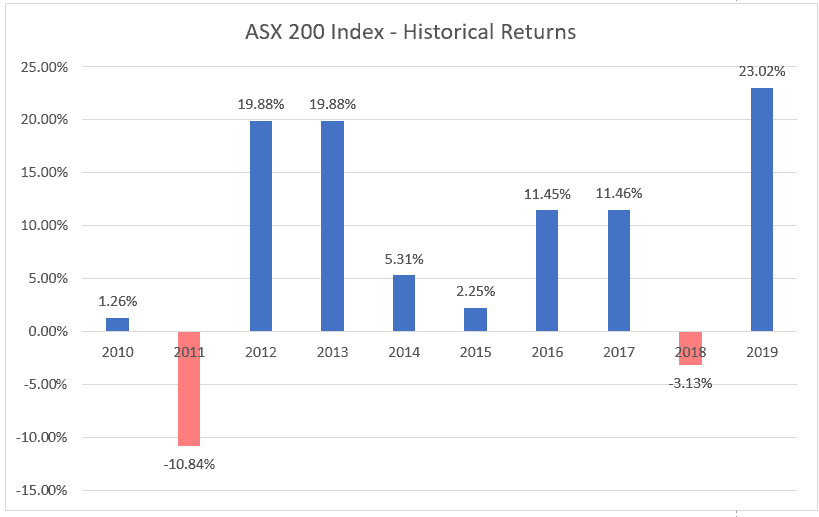
Here are the returns for the S&P/ASX 200 Index from 2010 to 2019, courtesy of S&P Global. These numbers assume the reinvestment of all dividends, but don't include the value of the franking credits that often also come with those dividends.

Year  ASX 200 Return
2010 1.26%
2011 (-10.84%)
2012 19.88%
2013 19.88%
2014 5.31%
2015 2.25%
2016 11.45%
2017 11.46%
2018 (-3.13%)
2019 23.02%

Here's a graph showing this data for some extra visualisation:

ASX 200 10-year historical returns
Chart: author's own| Data: S&P Global

And here's what these numbers look like if they're annualised:

4.5% per annum (pa) over the past 3 years, 7% pa over the past 5 years, and 6.61% pa over the past 10 years.

For some additional context, the ASX 200 is currently down 7.47% so far in 2020 (year to date).

10 years of returns, 1 reason to invest

Looking at this data, one thing is abundantly clear: ASX 200 shares go up far more often than they go down. Over these 10 years, just 2 delivered negative returns. And in 5 out of 10 years, the annual return for the ASX 200 was more than 10%. In fact, 3 out of 10 years gave investors a near 20% return.

I like those odds. 

Of course, critics might point out that this periodical data is bookended by 2 major share market crashes which aren't reflected in these numbers: the global financial crisis of 2008-09, and of course the 2020 March/April coronavirus-induced share market crash. But the reality is that the ASX 200 has never failed, in history, to break its previous all-time high following a market crash. Yes, the ASX 200 is a long way today from its February all-time high of 7,161 points. But history tells us that this will happen again, it's just a question of when. 

So, now that you've seen 10 years of ASX 200 historical returns, I hope you're feeling as inspired as ever to invest. And remember, these returns just reflect the ASX 200 index. You can pretty much match this index if you invest in an index fund like the iShares Core S&P/ASX 200 ETF (ASX: IOZ). Or you can try beating these returns by creating your own share portfolio yourself.

Motley Fool contributor Sebastian Bowen has no position in any of the stocks mentioned. The Motley Fool Australia has no position in any of the stocks mentioned. We Fools may not all hold the same opinions, but we all believe that considering a diverse range of insights makes us better investors. The Motley Fool has a disclosure policy. This article contains general investment advice only (under AFSL 400691). Authorised by Scott Phillips.

More on ⏸️ Investor Education

A boy with question mark on his forehead looking up as if watching an ASX share price
⏸️ Investor Education

How is the ASX 200 Index (ASX:XJO) share list compiled?

How does the ASX 200 Index work exactly?

Read more »

Legendary share market investing expert and owner of Berkshire Hathaway Warren Buffett
⏸️ Famous Investors

Best ASX ETF? This fund would be Warren Buffett's top pick

Which ASX ETF would Warren Buffett pick today?

Read more »

A piggy bank hooked up to mechanical devices, indicating complex financial constructs such as futures trading
⏸️ Investor Education

What are ASX 200 futures and how do they work?

Has not knowing what ASX futures are been 'deriving' you crazy? We have you covered.

Read more »

man popping a bubble containing a graph on share market prices
⏸️ Famous Investors

'Big Shorter' Michael Burry calls biggest share market bubble of all time

An ominous forecast from an iconic US hedge fund manager?

Read more »

Bold red letters spelling out the word stonks
⏸️ International Shares

What is a meme stock, and why is everyone talking about them?

Stocks going viral, what does that meme?

Read more »

feet of investor like warren buffett walking up chalk-drawn steps
Value Investing

No savings at 40? I'd use the Warren Buffett and Charlie Munger method to get rich

Following Warren Buffett and Charlie Munger’s investment strategy could lead to high returns in the long run – even from…

Read more »

ASX share investor sitting in front of lap top with head in hands
⏸️ Investor Education

4 ways to lose all your money

Here are the psychological traps some investors fall into. Be aware of these and avoid being sucked in yourself.

Read more »

a man in a business suit leans in to burst a huge bubble with a pin, indicating a major share market crash
Share Market News

We're in a massive bubble: This is when it'll pop

'The most important event of your investing lives' is coming, says legendary investor. Here's how to prepare for a terrifying…

Read more »