This article was written by Mark Crosby, Professor at Monash University, and originally appeared on The Conversation, a not-for-profit news site dedicated to unlocking ideas and knowledge from academic experts.
Since President Trump tweeted about imposing new tariffs on China, global equity markets have gone into a tailspin.
Trump's more recent announcement that the new tariffs would be delayed has not calmed the markets, with recent days seeing very large falls in most major stock markets.
Another factor particularly spooking the markets in recent days has been the "inversion of the yield curve" in the United States.
The yield curve is a graph showing the relationship between interest rates earned on lending money for different durations.
Normally, someone who lent to the government or a corporation for one year (by buying a one-year government or corporate bond) would expect to get a lower interest rate than someone who lent for five or ten years, making the yield curve upward-sloping.

An inverted curve slopes down
A simple way to get an idea of the slope of the yield curve is to compare a short-duration government interest rate for a two- or three-year government bond with the rate on a ten-year government bond.
In Australia the ten-year government bond rate has just fallen to a record low 0.891%, only slightly above the three-year rate at around 0.7%.
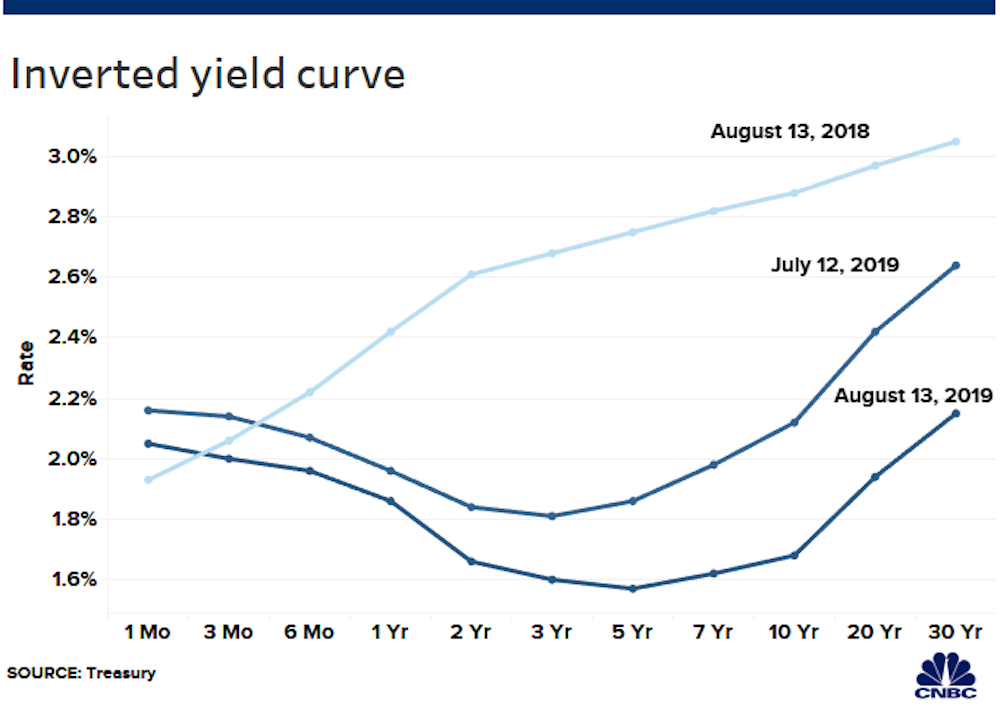
In the US in recent days the ten-year bond rate has fallen to the point at which the ten-year rate is below the two-year rate – so the yield curve is inverted.
What has made the markets so nervous is that there has been a yield curve inversion before each of the past seven recessions.
The graph below plots the difference between the US ten-year government bond rate and the US two-year government bond right back to the 1970s.
When the difference is negative (when the ten-year bond rate slips below the two-year bond rate), the line moves below zero.
It has done it just before each of the US recessions, which are also marked.
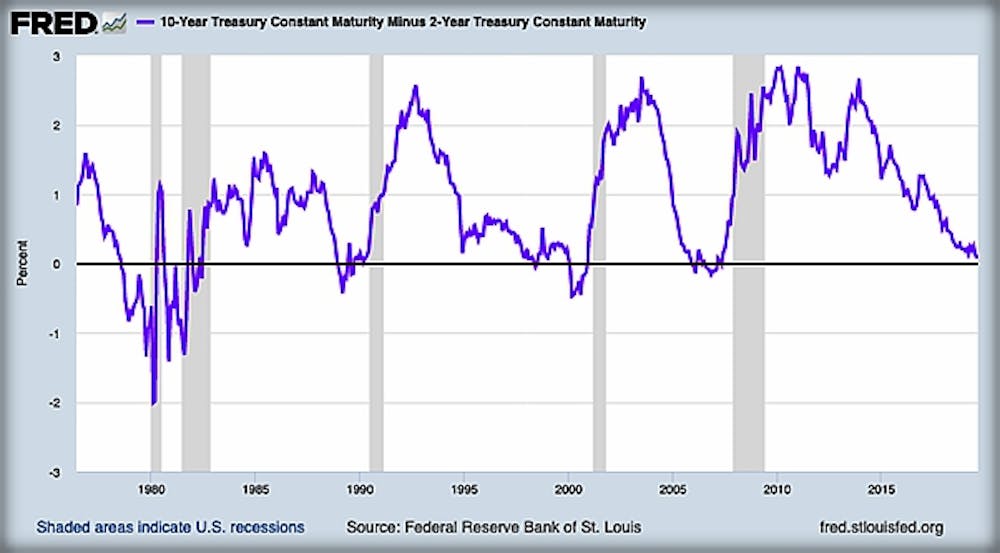
Sometimes the recession follows soon after the line slips below zero, and sometimes there is a delay. Interestingly, in the case of the most recent recession the yield curve inversion was quite small, and began some time before the global financial crisis.
So does correlation imply causation? Reserve Bank deputy governor Guy Debelle said on Thursday that this time is different.
We should certainly hope so.
There are good reasons to think that this time it will be different.
No recession this time?
One reason is that although central bank controlled rates are near record lows, most central banks have also announced words to the effect of "doing what it takes" to support the economy. With the markets expecting further rate cuts, long-term rates might simply reflect this rather than expectations of a recession.
Of course, it could be that markets see central banks' cuts as a sign that they see a recession coming. It's hard to tell.
Another reason to think it might be different this time is that President Trump pressured the Federal Reserve to cut rates. Many economists think the latest rate cut took place for that reason rather than because of economic fundamentals.
The simple point here is that a lot of things are different this time.
Many economists, like myself, view recent moves by central banks to cut rates as unproductive.
The gist of these arguments is that the Australian economy has reasonably strong fundamentals, and any weakness can be better dealt with by measures other than rate cuts. Among them would be measures to boost productivity.
In the US, by contrast, there are indeed reasons to be concerned about a recession.
The trade war with China has already been very destructive, and the political uncertainty of Trump, high debt levels and other structural weaknesses are creating problems.
A US-only recession?
The last time the US entered recession was September 2008. During that quarter global trade fell off a cliff, but in the year that followed Australia's economy grew by a solid 4%.
Supporting Australia's economy was a very large Chinese stimulus package that led to very strong demand for Australian resources.
A recession in the US in the next year or two would again lead China to consider all options. Traditionally those options have included much more funding for resource intensive infrastructure.
While that is the most likely path that China would take, it probably has less financial room to supercharge infrastructure than in 2008. That's enough of a reason for Australians to be very concerned if the US goes into recession.
In the end though it is well to remember that Australia's economy is still in a reasonably strong position compared to others. Unemployment is low, wages growth is higher than it was at 3.1%, public debt is low and other fundamentals are reasonably sound.
But predicting recessions is notoriously difficult.
There are some who have successfully predicted nine of the last two recessions in Australia, and those pundits are very pessimistic now!
I tend to be more of the view that the probability of a recession in Australia in the next year or so is higher than it has been since 2008, but a recession is far from the sure thing that yield curve readers might suggest.