The Telstra Corporation Ltd (ASX: TLS) share price will be one to watch closely this morning following the release of its highly anticipated full year results.
What happened in FY 2019?
Telstra's FY 2019 results were in line with its guidance and market expectations. On a reported basis, total income fell 3.6% to $27.8 billion, EBITDA tumbled 21.7% to $8 billion, and net profit after tax sank 39.6% to $2.1 billion.
Telstra also provided its results on a guidance basis. This guidance assumed wholesale product price stability and no impairments to investments or core assets, and excluded any proceeds on the sale of businesses, mergers and acquisitions, and purchase of spectrum. It also assumed the nbn rollout and migration in FY 2019 was broadly in accordance with the nbn Corporate Plan 2019.
On a guidance basis, total income fell 2.6% to $27.8 billion, EBITDA (excluding restructuring costs) decreased 11.4% to $9.4 billion, and underlying EBITDA decreased 11.2% to $7.8 billion.
Management explained that the "largest reason for the decline in EBITDA was the impact of the nbn, with Telstra absorbing around $600 million of negative recurring EBITDA headwind in the period."
If you exclude the nbn headwind, underlying EBITDA would have decreased by approximately 4%.
Telstra estimates that to date the nbn has adversely impacted its EBITDA by approximately $1.7 billion. It also estimates that it is now around half way through the recurring financial impact of the nbn.
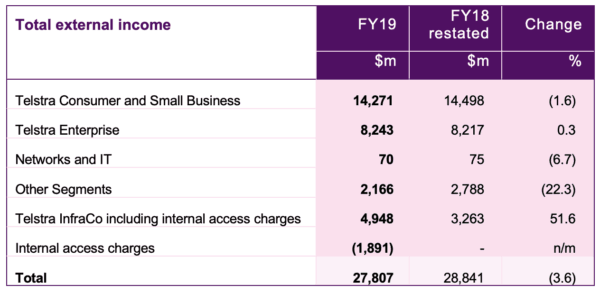
Here is a breakdown of how Telstra's segments performed in FY 2019.
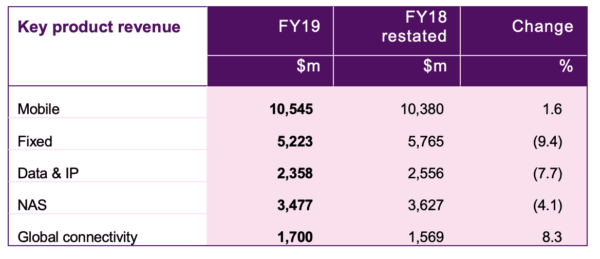
And this is a breakdown of its revenue generation during the 12 months.
Dividend.
As was widely expected by the market, the Telstra board opted to cut its fully franked final dividend down to 8 cents per share. This comprises a 5 cents per share ordinary dividend and a 3 cents per share special dividend.
Combined with its 8 cents per share interim dividend which was paid in February 2019, Telstra shareholders will receive a total dividend of 16 cents per share for FY 2019. This equates to a return of more than $1.9 billion to shareholders.
Outlook.
The telco company provided its guidance for FY 2020 and advised that it expects total income in the range of $25.7 billion to $27.7 billion and underlying EBITDA in the range of $7.3 billion to $7.8 billion.
It also expects restructuring costs of around $300 million, capital expenditure of $2.9 billion to $3.3 billion, and free cash flow after operating lease payments of $3.4 billion to $3.9 billion.
The release explains that the company has forecast FY 2020 to be the biggest in-year nbn headwind to date, with between $800 million to $1 billion expected from the recurring impact of the nbn.
However, it suggested investors look beyond this and focus on its underlying EBITDA, which is expected to grow by up to $500 million in FY 2020. Management believes this provides the clearest view of future financial performance of the business, as it excludes the recurring in-year headwind of the nbn.
CEO Andy Penn said: "Returning our business to growth will take time. However, I have great confidence that our strategy can arrest the decline in our earnings and create opportunities for growth. Today we are already a very different, much simpler and more customer focussed organisation than we were a year ago and we are well positioned for the era in which we are about to head – the 2020s."