A head-and-shoulders pattern is a formation on a technical analysis chart that indicates a security or commodity is in the process of reversing gains or losses.
In a declining trend leading to losses, the pattern is illustrated by a rise and fall in the price, followed by a higher increase and decrease, and then a final pattern displaying a rise and fall that resembles the initial change.
A 'neckline' – which can be a straight line under the head and shoulders – underscores the pattern. For a trend showing future gains, the pattern reverses, meaning the head-and-shoulders pattern is essentially inverted.

Image source: Getty Images
Identifying the head-and-shoulders pattern
Technical analysis uses price trends observed on charts to identify investment opportunities. Many investors believe compiling historical prices and visualising the data can reveal promising investments.
Technical analysts use several different patterns to identify potentially worthwhile investments.
Stock chart patterns include double tops, double bottoms, cups and handles, flags, and triangles (ascending, descending, and symmetrical). The most well-known pattern, however, is the head-and-shoulders formation, which signifies a reversal of a bullish or bearish trend.
In a head-and-shoulders pattern, the left shoulder is indicated by a hump that shows a rise and fall in prices. It's followed by a more prominent hump, which, in turn, is followed by a smaller rise and fall that resembles the initial hump.
In a classic head-and-shoulders pattern, a horizontal 'neckline' can be drawn underneath all three humps. If prices continue to fall past the neckline after the right shoulder — the most recent decline — then the trend is most likely bearish.
An inverted head-and-shoulders pattern that reflects a bullish trend is also possible. In this case, the head and shoulders are inverted. Prices reach a low before recovering, fall sharply before recovering again, and finally go through a final fall-and-rise trend, with the final rise approximating the starting point. Like the declining head-and-shoulders pattern, a neckline can be discerned above the head and shoulders rather than below them.
Reading the pattern
When you identify a head-and-shoulders pattern, it's generally safe to assume that a stock or commodity price is going up or down. Unfortunately, it's not always apparent that a head-and-shoulders pattern is present.
Inexperienced investors often need help identifying a head-and-shoulders pattern. It's easy to misread a pattern based on complete volume. If the volume of traded shares doesn't decrease as the price moves higher, a decline might be only for a brief period rather than part of a long-term trend. Likewise, the decline could be short-lived if volume doesn't increase when the price moves below the neckline.
Time is an element
Inexperienced analysts can often rely on the shape to assume charts display a bearish or bullish trend.
A common rule of thumb, however, is that the rise on the initial shoulder needs to be twice as long as the distance between the shoulders for the head-and-shoulders pattern to accurately reflect an actual trend and not just a brief blip in prices. This is a problem for intraday traders discovering head-and-shoulders-like patterns on one or four-hour charts.
Examine the neckline
A neckline is rarely perfectly horizontal. But you'd like to see either a relatively horizontal line or one ascending, that is, rising from left to right. A descending neckline that falls from left to right indicates a weak pattern.
Finally, make sure that you're looking at an actual head and shoulders pattern. If one shoulder is higher than the head, you're not.
Don't rely on an apparent downward trend near the end of a head and shoulders pattern to form the basis for an investment decision. Stock and commodity prices have a habit of being volatile and moving erratically, and you don't want to jump the gun.
Head and shoulders example
Sometimes, it's possible to use a head and shoulders pattern to spot a counterintuitive trend. After Russia invaded Ukraine, for example, most analysts predicted that natural gas prices would soar when sanctions were imposed on Russia and gas supplies shut off to most of Europe, especially with winter approaching.
A stock chart, however, indicates a very different story began to emerge early in the winter of 2022. In the immediate wake of the invasion, natural gas prices rose sharply, peaking in early June. They continued to fall for the next month before rising again. Prices peaked in August before falling, then dropped throughout the fall, rising again and falling below the neckline in late December.
Natural Gas Prices, February 2022-2023
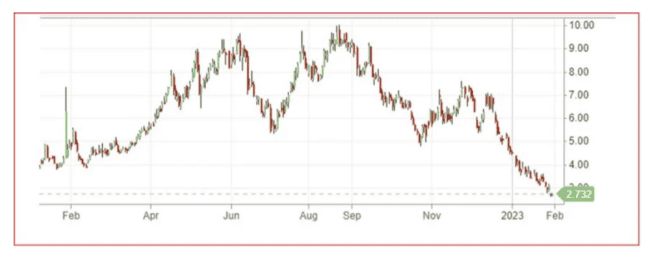
Several things stand out about this chart. First, the pattern of the head and shoulders is relatively clear, with a horizontal neckline. It occurs over a lengthy period — almost an entire year. Volume was also reasonably healthy. Between 1 February 2022 and 30 January 2023, the average daily volume approached 113,000, a sufficiently large amount to discount the possibility of outliers.
A head-and-shoulders pattern isn't an ironclad guarantee of a trend reversal, and we shouldn't use it as the only criterion for a significant investment. Patterns are no substitute for diligent and careful research and analysis.
A head-and-shoulders pattern occurs when asset prices are reversing recent trends. Technical analysts look for these patterns in stock price charts to help identify investment opportunities. A typical head-and-shoulders pattern describes a situation where prices reverse recent gains. Rising prices reach an initial peak (the left 'shoulder') before correcting and rising to an even higher peak (the 'head') before correcting again and rising back to roughly the same height as the initial peak (the right 'shoulder'). From this point, prices will fall below the 'neckline' and continue downwards. As such, a typical head-and-shoulders pattern is bearish. However, head-and-shoulders patterns can also be inverted, which describes a situation in which prices reverse recent losses. We observe the exact price chart pattern, just upside down, so prices continue upwards after breaking through the neckline. This would be an example of a bullish head-and-shoulders pattern. The head-and-shoulders pattern is one of the more reliable price indicators that technical analysts use. It tends to occur quite often, making it easy for experienced investors to spot. It is also observed in all financial markets, meaning you can use it to trade stocks, commodities, or crypto. However, that doesn't mean it's foolproof. Beginner investors may mistake normal market volatility for a head-and-shoulders pattern, resulting in bad investment decisions. Before making trades, familiarising yourself with general market trends is wise. Either way, we advise against using chart patterns as the sole basis for an investment decision. While they can be handy tools to have in your investing toolkit, they are no substitute for thorough research and analysis. This pattern occurs when the market sentiment for a particular asset changes. In a typical head-and-shoulders pattern, market opinion about an asset's prospects switches from bullish to bearish. It could be in response to specific events. For example, an unfavourable piece of market news might cause investors to downgrade their price predictions on a stock. Or perhaps rising inflation leads to a decrease in the value of a particular country's currency. However, a head-and-shoulders pattern can also occur when overexuberant investors bid up an asset's price. If the market for an asset overheats and prices reach unjustifiably high levels, investor sentiment may turn against it, causing its price to decline.Frequently Asked Questions
