
Image source: Getty Images
If you've read my writing for any length of time, you'll know I have a favourite investing day of the year.
No, it's not the day I get my dividends – they're spread through the year.
It's not the day my favourite companies report earnings – though as an investment nerd, I really do like those days.
It's the day of the year that the most powerful image in investing is updated: it's Vanguard Index Chart Day.
And that day is today.
Happy Vanguard Index Chart Day, to all who celebrate (and that should be all of us).
I'll share the image in a second.
But first, I want to tell you why you should care. There are a few reasons, actually.
First, it gives you a number that represents the awesome power of 30 years of share market compounding.
A single number that says 'this is what can happen if you invest and wait'.
Well, two, actually: the total value of a hypothetical investment, and what that looks like as an annual percentage return.
The best part of that? It shows that what is, on the surface, not a particularly big percentage return in a single year can compound to an extraordinary degree.
And second, it puts all of the daily, weekly, monthly and even yearly share price volatility into extreme perspective, and gives us a reminder why – as tempting as it is – we need to stop obsessing over short term price movements, and focus on the bigger picture.
That picture? Well, it's literally the index chart. But metaphorically, it's the story of human progress. Ingenuity. Effort. Applied intellect. Desire. Invention.
Here it is.
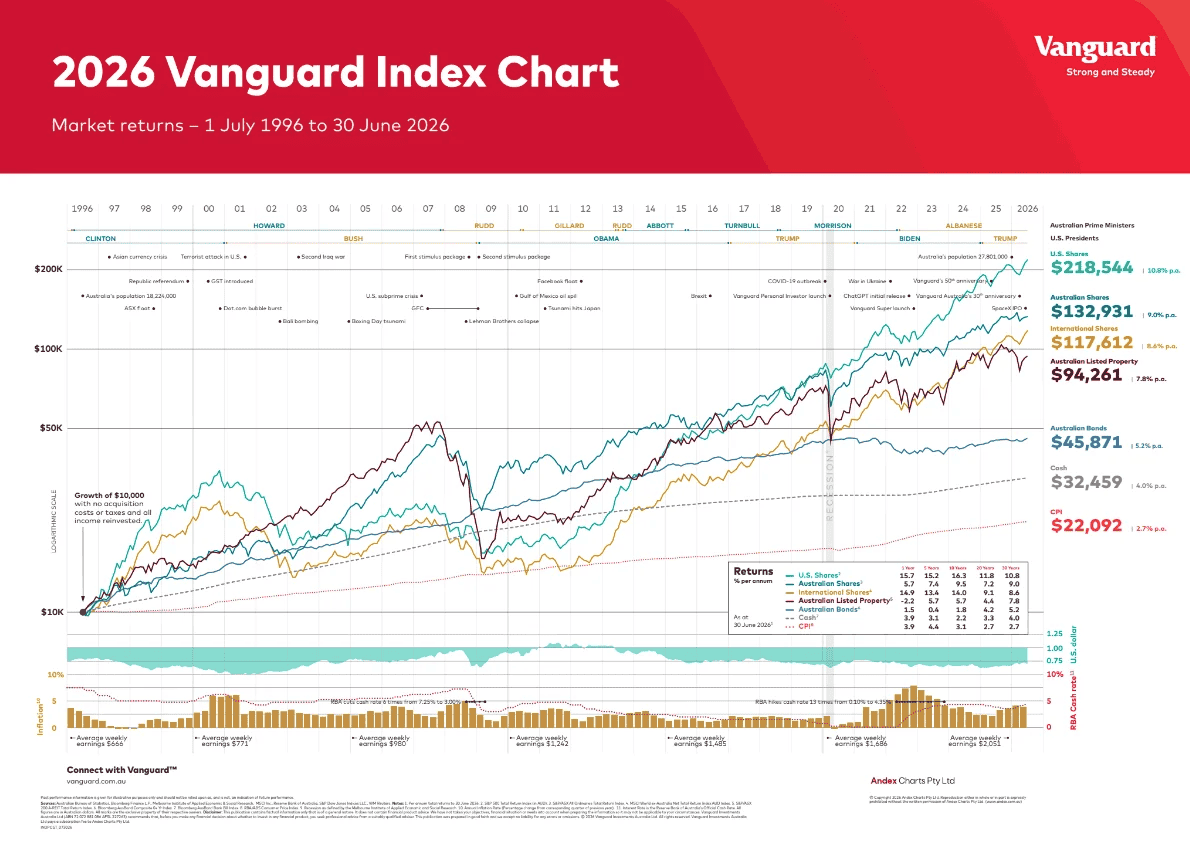
Things get better, over time. We instinctively know it.
No, they don't get better every single day. Or month. Or even year. But over time, progress is astonishing.
And the share market gives us a chance to hitch our financial wagons to that progress.
All we had to do was invest and wait.
(Had? Yes, I'm not allowed to make promises. I can't say 'all you have to do is invest and wait' because that would imply the future was certain. What I will say is 'all I'm going to do is invest and wait', and 'all I think investors should do is invest and wait'!)
Okay, the numbers that tell me why.
If you'd invested a hypothetical $10,000 in the ASX in 1996, according to Vanguard, you would have been sitting on $132,931 (before fees and taxes) 30 years later: a 9% annual average compound return.
(Even more if you'd invested in US shares… but that's a conversation for another day.)
Read that again: you would have grown your portfolio 13-fold in 30 years by doing… nothing.
Literally nothing.
If you'd have added more money, regularly? Your portfolio would have grown far, far larger.
Einstein probably never said compounding was the eighth wonder of the world… but he should have!
The one thing you did have to do? Nothing. But I mean that in an active sense. You had to have the patience and discipline to leave well enough alone.
Many people can't do that. Or don't realise they should.
They get impatient. They fiddle. They try to time the market. When they could have just stood pat and saw their portfolio grow extraordinarily over three decades.
I'm not saying you can't invest actively and beat the market by choosing superior investments, by the way. But I am saying that (too much) activity can be the enemy of compounding, particularly if you try to pick the times to 'go to cash'.
The first rule of compounding: Never interrupt it unnecessarily. (A quote attributed to Charlie Munger, who also probably didn't say it.)
And I've stopped well short of writing 1,000 words, because the picture, as they say, tells a thousand words instead.
This one also tells $132,931.
Do yourself a favour: print it out. Commit it to memory. And next time you're tempted to try to guess where the market is headed next, have another look at it.
There were lots of falls over the last 30 years. There will be a lot over the next 30, too, in all likelihood. You'll be tempted to react to headlines, forecasts, and your own fear and greed.
Don't.
Invest. Stay the course. Add regularly.
That's the lesson of history, and I suspect the 2056 Vanguard Index Chart will tell us something very similar.
The picture on that chart starts now. Don't miss out.
Foo on!