Oil prices are falling again on Tuesday as traders react to the proposed peace agreement between the United States and Iran.
At the latest check, West Texas Intermediate (WTI) crude oil is trading at US$81.26 a barrel, while Brent crude has fallen to US$83.59 a barrel.
Both benchmarks lost close to 5% during the previous session and have now fallen by more than 20% over the past month.
The decline has pushed oil prices back towards levels last seen before the conflict caused major disruption to supplies from the Persian Gulf.
The next question is whether crude can hold above US$80 a barrel.
Let's dive right in.
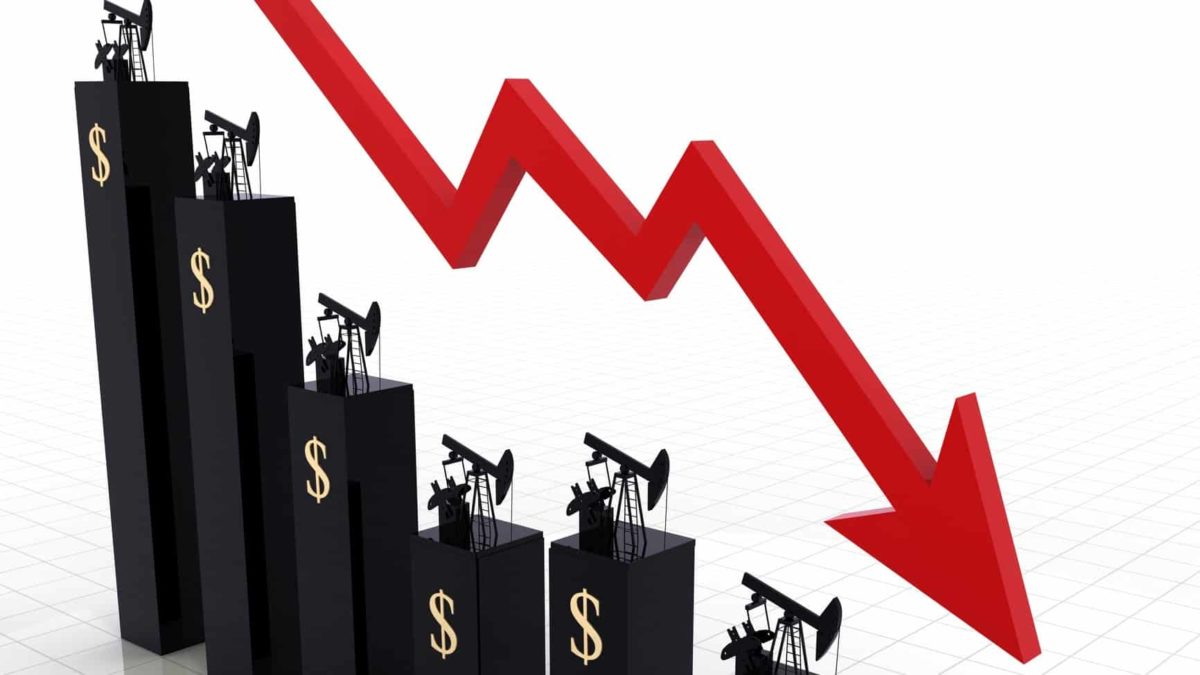
Image source: Getty Images
Supply fears are fading
The United States and Iran have reached an interim agreement that could end the conflict and reopen the Strait of Hormuz.
It is expected to be formally signed in Switzerland on Friday.
US President Donald Trump has said oil shipments from the Persian Gulf can resume once it takes effect. The US blockade of Iranian ports is also expected to be lifted.
The waterway handles around 1/5th of global oil shipments, making it an important energy route.
The prospect of those shipments returning has eased some of the supply concerns that pushed oil above US$100 a barrel earlier this year.
However, neither country has released the full terms of the deal. Shipping companies are still waiting for more details before sending vessels through the strait.
How low could oil go?
Some analysts expect crude to remain under pressure as more Persian Gulf supply returns to the market.
Citigroup has cut its average Brent crude forecast to US$75 a barrel for the third quarter and US$70 for the final 3 months of 2026.
Iran has also reduced the premium on its main light crude grade sold to Asian buyers.
The July premium has been lowered to US$7.15 a barrel above the Oman-Dubai average, down from US$13 in June.
Keep in mind, though, supply won't return all at once.
The mines still need to be cleared, while insurers and shipping companies must decide when it's safe to send vessels through the region.
Producers will also need time to restore output and restart export schedules.
Capital Economics expects energy flows through the strait to recover to around 80% of pre-war levels by September. Other estimates suggest a broader recovery could take roughly 4 to 6 months.
Geopolitical risks remain
There are still a few reasons for traders to remain cautious.
The United States and Iran have given different versions of what was agreed on regarding sanctions, frozen assets, and Iran's nuclear program.
Furthermore, Israel was not directly involved in the talks, while military activity in Lebanon has continued.
And the full terms have also not been released publicly.
This leaves the oil market exposed to further volatility if the ceasefire is delayed or regional tensions increase again.