What is the 'Buffett Indicator'? And what is it signalling right now?

Warren Buffett believes this tool is one of the best ways to value the market.

| More on:

You’re reading a free article with opinions that may differ from The Motley Fool’s Premium Investing Services. Become a Motley Fool member today to get instant access to our top analyst recommendations, in-depth research, investing resources, and more. Learn More

Warren Buffett, the outgoing CEO of Berkshire Hathaway Inc (NYSE: BRK.A; NYSE: BRK.B), is known as the 'Oracle of Omaha' for a reason.

Buffett has delivered outstanding results for more than half a century, consistently beating the market with his soothsayer like abilities.

Towards the end of last year Buffett started to downsize Berkshire's positions in key holdings such as Bank of America (NYSE: BAC) and Apple Inc (NASDAQ: AAPL).

Once again, Berkshire Hathaway's cash pile grew and then markets tumbled.

Buffett's ability to seemingly gaze into the future is built on focus, a disciplined investing mindset, and a talent for analysing companies and markets.

And one of the investing tools Buffet has utilised over the decades to determine whether or not the market is over valued has come to be known as the 'Buffett Indicator'.     
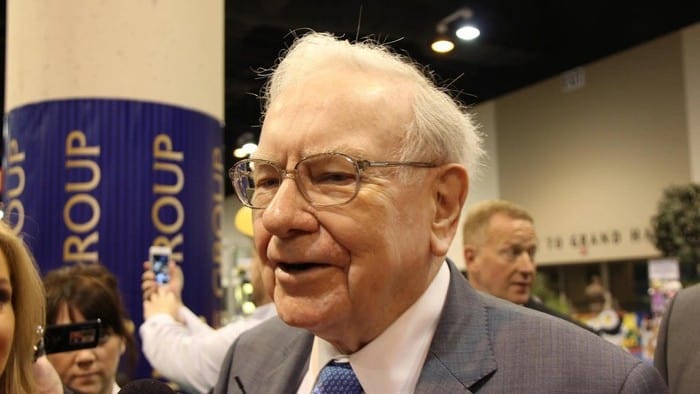
In fact, Warren Buffett told Fortune Magazine the indicator is "probably the best single measure of where valuations stand at any given moment".

Warren Buffett

Image source: Getty Images

What is the Buffett Indicator?

The Buffett Indicator is simply a method of comparing the total value of the stock market to gross domestic product (GDP).

From there, it can be determined whether or not the market is overvalued by looking at how closely aligned it is with the state of the economy.

This is done by dividing the total value of the stock market by GDP.

If the result is 1, or 100%, the market is in sync with the economy, based on the indicator.

If the figure is higher, it can suggest the market is overvalued.

Conversely, if the figure is lower than 1, it may show the market is undervalued.

What does the indicator say about the ASX?

The total market cap of all companies listed on the ASX is currently sitting at around $3.29 trillion.

Based on projections from the International Monetary Fund, Australia's GDP for 2025 is expected to be around $2.74 trillion.

If we divide the ASX market cap by projected GDP, we are left with a figure of 1.2, or 120%.

As such, depending on how the Buffett Indicator is interpreted, it appears the ASX's valuation is ranging from fair value to overvalued.

Of course, to give more meaning and context to readings from the Buffett Indicator, results should be compared to historical averages.

And it should be noted that while the Buffett Indicator can be a useful tool, it is just one way of gauging a share market's fair value.

Bank of America is an advertising partner of Motley Fool Money. Motley Fool contributor Steve Holland has no position in any of the stocks mentioned. The Motley Fool Australia's parent company Motley Fool Holdings Inc. has positions in and has recommended Apple and Bank of America. The Motley Fool Australia has recommended Apple. The Motley Fool has a disclosure policy. This article contains general investment advice only (under AFSL 400691). Authorised by Scott Phillips.

More on How to invest

A smiling woman with a handful of $100 notes, indicating strong dividend payments
How to invest

3 simple ways to build a $50,000 passive income from ASX shares

Some investors may need to build wealth first. Others could already be close enough to focus directly on dividends.

Read more »

A piggy bank is shaded by a sun umbrella on a beach.
How to invest

ASX investors have a once-in-a-decade opportunity for safe cash flow

This window might not be open for long.

Read more »

Two colleagues at work looking at a tablet and smiling at a rising share price.
How to invest

How I would build a strong ASX share portfolio from scratch

Good portfolio construction is about more than finding promising shares. Flexibility can be just as valuable.

Read more »

A trendy woman wearing sunglasses splashes cash notes from her hands.
How to invest

How to build a $50,000 passive income from the ASX

Looking to build an income? Here is how you could do it with ASX shares.

Read more »

A happy young couple lie on a wooden deck using a skateboard for a pillow.
How to invest

How to go from zero to $100,000 with ASX shares

I think a simple monthly investing habit could turn a standing start into a six-figure portfolio.

Read more »

A young man goes over his finances and investment portfolio at home.
How to invest

What could $500 a month in ASX shares actually turn into?

With patience and consistency, a simple monthly habit can become far more powerful than it first appears.

Read more »

Couple holding a piggy bank, symbolising superannuation.
How to invest

How much is needed in superannuation to target a $3,000 monthly passive income?

A monthly pay check from your super would be hard to say no to.

Read more »

An older couple dance in their living room as they enjoy their retirement funded by ASX dividends
How to invest

How I would turn $200,000 into an ASX retirement income portfolio

The challenge is balancing income today with enough growth for the years ahead.

Read more »