
This article was originally published on Fool.com. All figures quoted in US dollars unless otherwise stated.
As of market close on April 7, the Nasdaq Composite has fallen by 19% so far this year, falling further into bear market territory.
Among the worst-hit Nasdaq stocks so far in 2025 are the "Magnificent Seven," each of which has posted negative returns on the year. During volatile times like these, it can be hard for investors to think rationally. In my eyes, much of the ongoing sell-off is rooted more in emotion than sound logic. While I understand fears related to uncertainty, I think some stock prices have simply fallen too far.
Let's explore why Amazon (NASDAQ: AMZN) looks like a no-brainer opportunity at its current price point and assess how the company is positioned to navigate the current macroeconomic challenges.
Amazon stock has become too cheap to ignore
Amazon is a challenging company to value for a variety of reasons.
First, the company's net income can exhibit notable fluctuations depending on the quarter. Some reasons for this include seasonality as it relates to the core e-commerce segment and macro factors such as inflation, interest rates, and the impacts those can have on consumers and corporations alike. In addition, net income is not really a true indicator of Amazon's profitability, given some of the nuances under generally accepted accounting principles (GAAP).
Second, the price-to-sales (P/S) multiple isn't entirely helpful when valuing Amazon. While there are other large-scale online storefronts, Amazon is an enormous operation that includes streaming, advertising, artificial intelligence (AI), grocery delivery, and cloud computing. Given that Amazon sources revenue from so many different avenues, it's hard to come up with a thorough list of comparable companies to benchmark against.
For these reasons, I like to look at Amazon on a cash-flow basis and compare the company to ... itself.
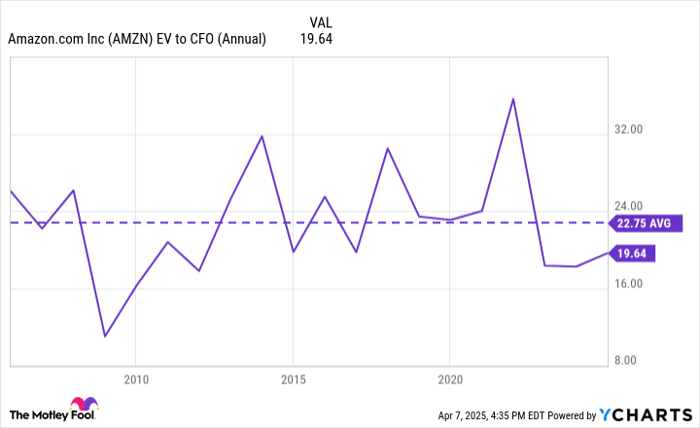
AMZN EV to CFO (Annual) data by YCharts. EV = enterprise value. CFO = cash flow from operations.
The chart above illustrates Amazon's enterprise value to cash flow from operations (EV/CFO) over the last 20 years. One thing that sticks out right off the bat is that Amazon's current EV/CFO of 19.6 is trading at a discount compared to the company's long-run average of 22.7. However, another thing that sticks out to me is just how much the company's EV/CFO has compressed over the last several years.
Said differently, the last time Amazon traded at an EV/CFO of around 20 was sometime after 2010 (between 2011 and 2012, based on the trends above). This trend suggests that Amazon stock is trading at its cheapest levels in over a decade, based on operating cash flow.
Buy the dip and hold on tight
I think the biggest factor influencing the Nasdaq sell-off right now is President Donald Trump's new tariff policies. I'll concede that there are a lot of unknowns about how these tariffs will shake out in terms of trade negotiations and relations with other countries. On the surface, I can understand why a global business such as Amazon may look vulnerable right now.
But to me, these concerns are far overblown. While tariffs could lead to higher prices for some goods and services, I tend to think that brick-and-mortar outlets and smaller retailers will feel outsized pressure. Amazon has an opportunity to take advantage of these dynamics and make its e-commerce store (which is already known for its affordable prices) more appealing to the average consumer.
Just take a look at the trends in the chart below. The grey shaded columns represent U.S. recessions over the last 20 years. Even during times of recession and economic uncertainty, Amazon has done an unquestionably good job generating consistent cash flow over the last two decades.

AMZN Cash from Operations (Annual) data by YCharts.
I believe this makes the company's discounted valuation all the more perplexing. It's these very profits that have allowed Amazon to invest beyond the core e-commerce business and develop new products and services. It's as if investors haven't given Amazon much in the way of credit for evolving from a primarily online storefront 20 years ago to the diversified behemoth it is today.
In my eyes, Amazon is not only trading for a bargain but also remains in a strong position despite ongoing economic uncertainty. I think now is a lucrative opportunity for long-term investors to buy the dip in Amazon and prepare to hold on tight.
This article was originally published on Fool.com. All figures quoted in US dollars unless otherwise stated.