This article was originally published on Fool.com. All figures quoted in US dollars unless otherwise stated.
You probably don't need me to tell you this, but 2022 has been one of the most challenging years on record for everyone from Wall Street professionals to everyday investors. The first half of the year saw the benchmark S&P 500 (SNPINDEX: ^GSPC), which is the broadest barometer of stock-market health, produce its worst return in 52 years. The growth-dependent Nasdaq Composite (NASDAQINDEX: ^IXIC) fared even worse, with the index losing as much as a third of its value on a peak-to-trough basis.
With two of Wall Street's big three indexes falling into bear market territory -- the timeless Dow Jones Industrial Average (DJINDICES: ^DJI) maxed out at a peak decline of 19% -- and testing the resolve of investors, the critical question has become: "Where will the bear market bottom?"
While the official answer is that we don't know with any certainty, history offers a number of very clear clues as to where the S&P 500 could trough. In particular, two indicators provide a range of where we can expect the bear market to bottom.
Valuation plays a key role during bear markets
Whereas Wall Street is willing to tolerate higher valuations when the U.S. and global economy are firing on all cylinders, analysts and investors become much more critical of stock valuations when corrections and bear markets arise. That's why the S&P 500's forward-year price-to-earnings (P/E) ratio can come in handy.
The S&P 500's forward P/E divides the aggregate point value of the S&P 500 Index into the consensus earnings per share forecast for Wall Street in the upcoming year (in this instance, 2023).
With two exceptions -- the Great Recession between 2007 and 2009, where valuations were truly depressed given the uncertain state of the U.S. financial system, and the double-digit percentage pullback for the broader market in 2011 -- the S&P 500's forward P/E has accurately predicted the bottom of every other notable decline since the mid-1990s. Specifically, we've witnessed the benchmark index's forward-year P/E bottom between 13 and 14. This is where the S&P 500 found its bottom following the dot-com bubble in 2002, during the nearly 20% pullback in the fourth quarter of 2018, and following the coronavirus crash.
As of Aug. 31, the S&P 500's forward-year P/E stood at 16.8. Based on the noted range of 13 to 14, this would imply further downside to the S&P 500 of 16.7% to 22.6%. In other words, as long as the earnings component of the benchmark index doesn't drastically change, this indicator would imply a bear-market bottom between 3,061 and 3,296.
Margin debt tells a grimmer story
While the S&P 500's forward-year P/E ratio provides an upper bound of where history would suggest the bear market is headed, outstanding margin debt tells a more worrisome story.
"Margin debt" describes the amount of money being borrowed, with interest, by investors to purchase or short-sell securities. Although it's perfectly normal for margin debt to increase over time as the value of U.S. equities grows, it's anything but normal to see margin debt rise significantly, on a percentage basis, over a short period.
Since 1995, there have only been three instances where margin debt increased by 60% or more on a trailing-12-month basis. It occurred immediately prior to the dot-com bubble bursting in 2000, just months prior to the financial crisis taking shape in 2007, and once more in 2021. Following the previous two instances where margin debt skyrocketed in excess of 60% in the trailing-12-month period, the S&P 500 lost 49% and 57% of its respective value before finding a bottom.
If we simplify this to a general loss of 50% of the S&P 500's value, the bottom range for the index, based on what margin debt history tells us, is 2,409 (half of the 4,818 intra-day high).
In other words, two leading indicators with a history of successfully calling a number of bear-market bottoms suggest the S&P 500 could fall to 2,409 in a worst-case scenario, or bounce up to 3,296 if corporate earnings hold up better than expected.
The one figure more powerful than any bear-market-bottom indicator
Obviously, these indicators could be wrong, and the June 2022 bear-market low of 3,636 could hold firm for the S&P 500. If there were indicators that were right 100% of the time, every Wall Street professional and retail investor would be using them by now.
Regardless of whether the S&P 500, Nasdaq Composite, and Dow Jones industrial Average have already found their respective bottoms or still have additional downside, one figure does offer a practical guarantee -- and all it requires is your patience.
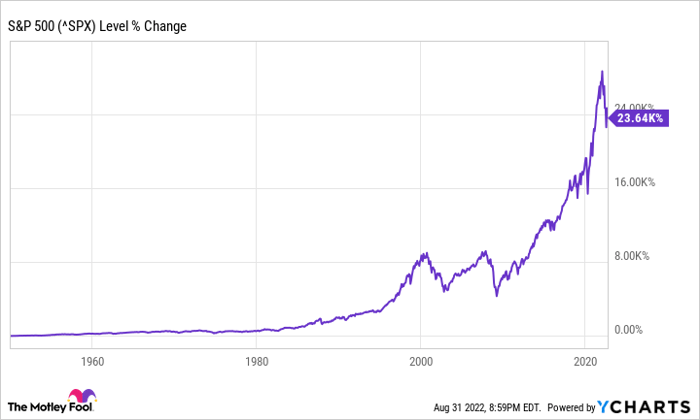
Every year, stock-market analytics provider Crestmont Research publishes data highlighting the 20-year rolling total returns (which include dividends paid) for the S&P 500 since 1919. In other words, Crestmont is looking at the average annual total return investors would have made by buying and holding an S&P 500 tracking index for 20 years over each of the past 103 end years (1919-2021).
The result? Investors made money 103 out of 103 times if they purchased an S&P 500 tracking index and held it for 20 years. What's more, approximately 40% of these 103 end years produced an average annual total return of at least 10.9%. Investors weren't just scraping by holding an S&P 500 index. They were doubling their money about every seven years in roughly 40% of all rolling 20-year periods.
That means that investors shouldn't be afraid to put money to work on Wall Street either now or in the future. If you're a long-term investor, time is a far more powerful ally than any bear-market bottom indicator.
This article was originally published on Fool.com. All figures quoted in US dollars unless otherwise stated.