This article was originally published on Fool.com. All figures quoted in US dollars unless otherwise stated.
There's no denying that it's been an uphill climb for Wall Street and investors since the year began. Remember that fabled walk to and from school in three feet of snow, uphill, both ways, which your parents told you about as a kid? This is the stock market equivalent of it.
Since the three major U.S. indexes hit their all-time closing highs between mid-November and early January, the iconic Dow Jones Industrial Average (DJINDICES: ^DJI), broad-based S&P 500 (SNPINDEX: ^GSPC), and technology-focused Nasdaq Composite (NASDAQINDEX: ^IXIC), have respectively tumbled by 19%, 24%, and 34%, as of June 16. More importantly, it firmly places the Nasdaq and S&P 500 in a bear market. The S&P 500 is often viewed as the best barometer of U.S. stock market health.
This indicator has correctly predicted five S&P 500 bear markets
Although some investors might be surprised by the S&P 500 losing nearly a quarter of its value in just over five months, one telltale signal with an impeccable track record correctly predicted this tumble. That indicator is the Shiller price-to-earnings (P/E) ratio, which is also referred to as the cyclically adjusted price-to-earnings ratio, or CAPE ratio.
Whereas traditional P/E ratios compare the price of a security to its trailing12-month earnings or its forecast earnings for the current or coming year, the Shiller P/E ratio is based on average inflation-adjusted earnings from the previous 10 years.
The telltale bear market warning has occurred anytime the Shiller P/E has crossed above and sustained 30. Aside from the fact that the average Shiller P/E since 1870 is just 16.95, pushing above 30 has a notoriously bad track record:
- 1929: Following the Black Tuesday crash, the broader market went on to lose most of its value during the Great Depression. The Dow Jones ultimately shed 89% of its value.
- 1997-2001: The S&P Shiller P/E ratio would hit an all-time high of 44.19 immediately prior to the dot-com bubble bursting. Following the market's peak, the S&P 500 lost about half its value.
- Q3 2018: During the second half of 2018, the Shiller P/E ratio found its way, briefly, above 30. During the fourth quarter of 2018, the S&P 500 lost 19.8% of its value, or 20% on a rounded basis. A decline of 20% is the accepted threshold for a bear market.
- Q4 2019-Q1 2020: In the six months leading up to the 33-calendar-day coronavirus crash, the S&P Shiller P/E ratio was, again, north of 30. The COVID-19 crash erased 34% from the S&P 500.
- Q3 2020-Q2 2022: Finally, the S&P Shiller P/E topped 40 prior to the S&P 500 rolling over in early January 2022. Thus far, the index is down 24%.
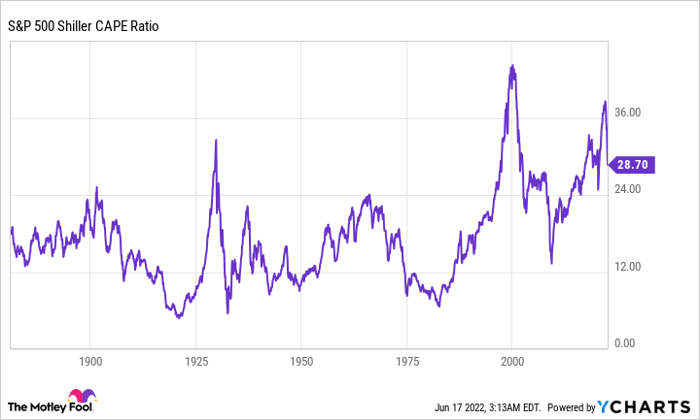
S&P 500 Shiller CAPE Ratio data by YCharts.
A few caveats to take into consideration
To recap, that's five instances since 1870 where the Shiller P/E ratio has topped 30, and five subsequent bear market retracements totaling 20% to 89%. It's simply never been wrong.
However, there are a number of caveats that should be understood before proclaiming this the greatest bear market telltale signal of all time.
For example, valuation "norms" have changed significantly over the past century. Prior to the mid-1980s, computers weren't exactly commonplace on Wall Street. It took quite a bit of time to disseminate information from businesses to Main Street, which allowed rumors to perpetuate. In other words, the environment wasn't conducive to supporting lofty valuations.
Since the mid-1980s, the information barrier between businesses, Wall Street, and Main Street, has gradually disappeared. Today, John and Jane Q. Investor can access income statements, balance sheets, and management commentary at the click of a button. This ease of access to information drives more investor risk-taking and has, therefore, inflated the Shiller P/E ratio over the past 25 years.
Something else to consider is that, even though the Shiller P/E ratio has a perfect track record of predicting an eventual bear market once valuations become extended, there's no telling how far above 30 it'll climb, or how long the Shiller S&P 500 will stay above 30. If you'd bet against the benchmark S&P 500 when it first crossed 30 during the third quarter of 2020, you'd still be underwater today, even with a 24% decline in the index.
Also, take note that valuation isn't always the reason a bear market takes shape. The COVID-19 pandemic that cratered the S&P 500 over the course of five weeks in 2020 had little to do with the perception of extended valuations.
Bear markets are a surefire buying opportunity for the patient
Although it may not seem like it at the moment, bear markets are, historically, the perfect time to invest.
When looking at the long-term performance of the S&P 500, one thing that's abundantly clear is that bull markets last considerably longer than corrections (that is, declines of at least 10% from a recent high). Since the beginning of 1950, the aggregate number of days spent in a bull market outweighs days spent in correction by roughly 2.6-to-1. This means every sizable correction is an opportunity for patient investors to strike.
If you're wondering where to invest, there are plenty of great ideas.
For instance, dividend stocks have a proven track record of outperformance. According to a 2013 report from J.P. Morgan Asset Management, a division of JPMorgan Chase, income stocks averaged a hearty 9.5% annual return between 1972 and 2012. By comparison, publicly-traded stocks that didn't pay a dividend gained an average of only 1.6% annually over the same time frame. Because dividend stocks are almost always profitable and time-tested, they make a good case to increase in value over time.
Interestingly, growth stocks can be smart investments when the U.S. economy weakens and the S&P 500 enters a bear market. A Bank of America/Merrill Lynch study published in 2016 found that over a 90-year period (1926-2015), value stocks outpaced growth stocks in the return column (17% to 12.8%, based on average annual return). But during periods of weakness, growth stocks performed considerably better than value stocks.
Investors can also buy an S&P 500 tracking index. According to data from Crestmont Research, if you, hypothetically, were to have bought an S&P 500 tracking index and held for 20 years at any point since 1900, you would have generated a positive total return, including dividends. There isn't a single point on the S&P 500's rolling 20-year timeline where this statement doesn't hold true.
Patience can pay off handsomely on Wall Street.
This article was originally published on Fool.com. All figures quoted in US dollars unless otherwise stated.