This article was originally published on Fool.com. All figures quoted in US dollars unless otherwise stated.
Most investors make an important mistake when they're building their investment portfolio, and it can be a costly one. Luckily, we can all take valuable insights from an important chart that's used by professional asset managers. This chart won't create the perfect portfolio for you, but it provides essential guidelines for building an investment allocation.
The efficient frontier
The efficient frontier is a chart that plots portfolio returns against portfolio risk.
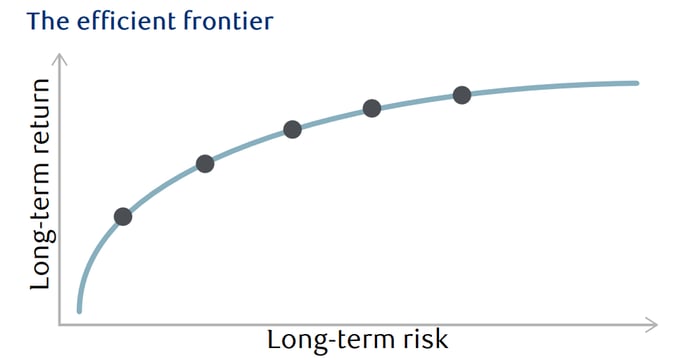
Source: RBC Wealth Management -- "Why does asset allocation matter?"
The chart is well-known among asset managers and financial advisors, but it's rarely mentioned by individual investors. Professionals have to focus more on risk management -- losses tend to shake a client's confidence in an asset manager. Meanwhile, financial media overwhelmingly covers market indexes and the performance of individual stocks.
Returns are intuitive. If you invest a certain amount of capital, the value of that investment grows or falls by a certain percentage. Over the long term, those returns are based on the fundamental performance of the asset. Companies that grow and produce profits tend to have stocks that appreciate. The stocks of unsuccessful companies generally lose value. That's all pretty straightforward.
Risk is a bit more complicated, and there are whole fields of study dedicated to understanding it to a high degree. Risk is defined in different ways, but portfolio risk usually refers to volatility. Volatility is generally calculated as the standard deviation of returns over a given period, and beta is a popular metric for measuring relative volatility. Portfolio returns tend to follow long-term trend lines, but they fluctuate over the short term around that trend. The bigger the swings in a portfolio's value, the higher a risk it's considered to be.
This chart suggests that there's a trade-off between investment risk and return over the long term. In an efficient capital market, investors are forced to accept more risk in exchange for higher expected returns. Equities are more volatile than bonds, but they produce larger gains in the long term. Growth stocks have higher upside than value stocks, but they're also prone to steeper losses due to high valuation ratios.
How the efficient frontier works
The efficient frontier is theoretical -- the exact numbers aren't really known or universally established. Instead, it represents the highest theoretical return that can be achieved at a given level of volatility. The curve is the collection of potential returns across the spectrum of risk, from low volatility to high.
From a portfolio composition perspective, any point along the frontier is just as valid as any other. It might seem odd to suggest that a strategy with a 6% average rate of return could be just as good as one with a 10% average return, but it's true in the context of asset management. Not everyone is in the position to assume the risk that's required to achieve higher rates of return, and the frontier illustrates a balance between the two. Investors with low risk tolerance can't achieve the same long-term growth as those with high risk tolerance.
Any point below the frontier is inferior to any point that's on the frontier. If a portfolio's long-term combination of volatility and returns places it below the frontier on a graph, then that portfolio is not compensating investors enough for the risk that's being taken. In that case, there are better allocations that could deliver more growth without adding any additional volatility.
Using the frontier
The key to portfolio management is to identify your optimal spot along the efficient frontier, then ensure that your investment strategy gets as close to the theoretical limit as possible. That's how the best allocations are defined, rather than simply the biggest gains over a small window.
The first step is to quantify risk tolerance, which should reflect time horizon and personality. Risk tolerance questionnaires are popular tools to accomplish this, and they allow investors to set a volatility target for a portfolio.
Once that volatility cap has been determined, it's important to maximize the potential growth within those boundaries. Obviously, that's easier said than done, and there are tons of variables and unknowns that dictate gains and losses moving forward. Fill your allocation with high-conviction stocks that will deliver growth, but make sure that it's governed by risk tolerance. That's the best way to place yourself on the right part of the efficient frontier curve.
People who have long time horizons and can stomach volatility are able to take more risks in favor of growth. Those portfolios should contain more growth stocks, small caps, and emerging markets. On the other end of the spectrum, some investors need to sacrifice growth to limit volatility. Those portfolios tend to have more bonds, dividend stocks, and stable value stocks.
A 30-year-old should generally focus on growth in their 401(k) or IRA. Investors nearing retirement have to pull back on the reins to ensure that they aren't forced to sell stocks at the bottom of a market cycle.
We're seeing this in action with the current stock market correction. Any retiree whose well-being is seriously jeopardized by this pullback has mismanaged their volatility exposure and ignored the efficient frontier.
This article was originally published on Fool.com. All figures quoted in US dollars unless otherwise stated.