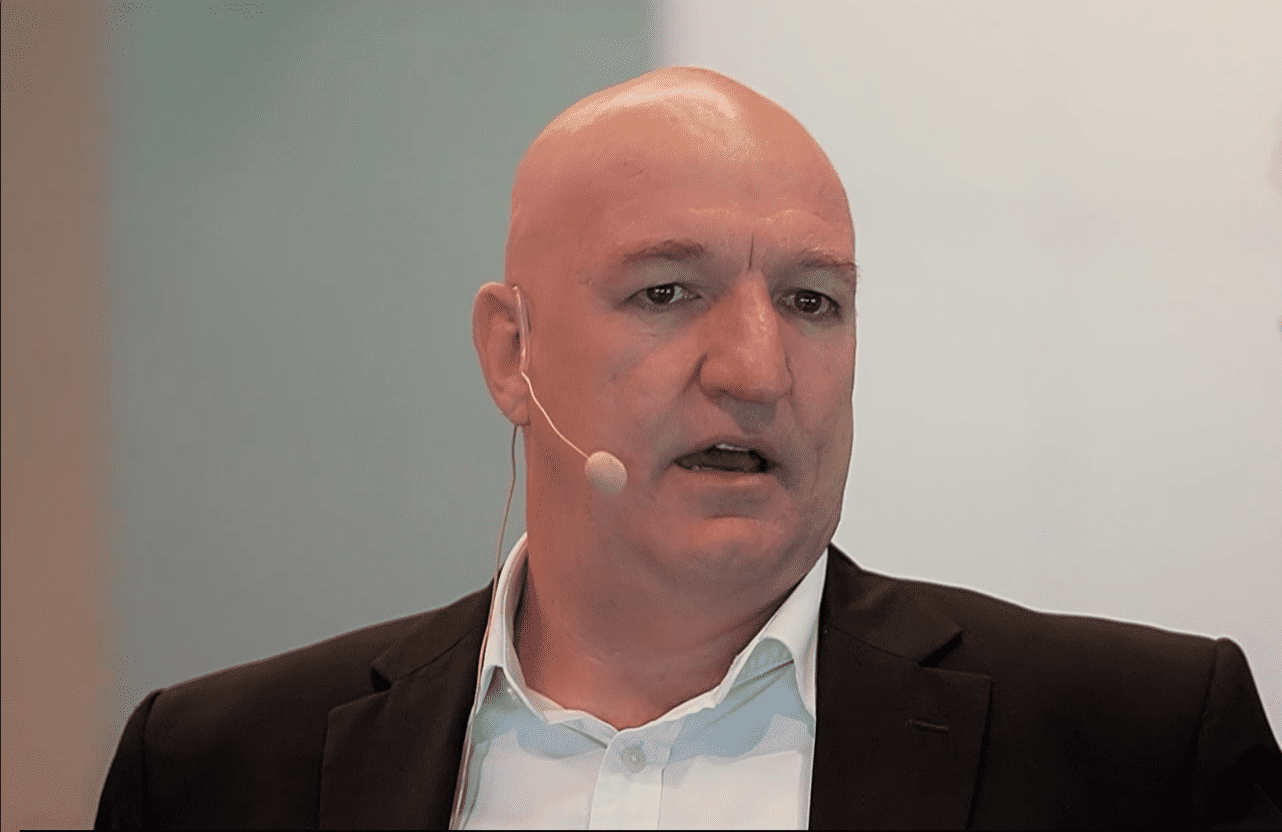

Energy One Ltd (ASX: EOL) Share Price and News
Price
Movement
(20 mins delayed)
52 Week Range
-
1 Year Return
Energy One Ltd Chart and Price Data
Fundamentals Data provided by Morningstar.
Data provided by Morningstar.
Market Cap
$544.52 million
P/E Ratio
56.08
Dividend Yield
0.00%
Shares Outstanding
38.84 million
Earnings per share
0.250
Dividend per share
0.08
Year To Date Return
-19.19%
Earnings Yield
1.78%
Franking
-
Share Price
Day Change
52 Week Range
-
Yesterday's Close
Today's Open
Days Range
-
Volume
Avg. Volume (1 month)
Turnover
as at 24 Feb 3:44pm
Energy One Ltd (ASX: EOL)
Latest News

Technology Shares
Energy One reports double-digit FY26 earnings growth

52-Week Lows
Are these oversold ASX shares too cheap to ignore?

Broker Notes
Brokers name 3 ASX shares to buy right now

Broker Notes
This mid-cap ASX tech share could be 30% higher in 12 months

ASX Share Market News
5 things to watch on the ASX 200 on Friday

Small Cap Shares
This energy focussed ASX small-cap could surge 50% as earnings build

Broker Notes
Ord Minnett tips these ASX All Ords shares to rise 30% to 50%

ASX Share Market News
Why did these ASX shares outperform their peers in 2025?

Technology Shares
Bell Potter just initiated coverage with a buy recommendation for this ASX technology stock

Technology Shares
Why this ASX tech share is an exciting buy right now

ASX Share Market News
Life360, NextDC, and Siteminder shares reach new highs amid tech sector lead last week

Share Gainers
The small ASX tech share ripping 33% higher amid a takeover bid
1❯
Dividend Payment History Data provided by Morningstar.
| Ex-Date | Amount | Franking | Type | Payable |
|---|---|---|---|---|
| 29 Sep 2022 | $0.0600 | 0.00% | Final | 20 Oct 2022 |
| 29 Sep 2021 | $0.0600 | 0.00% | Final | 18 Oct 2021 |
| 29 Sep 2020 | $0.0350 | 0.00% | Final | 16 Oct 2020 |
| 03 Oct 2019 | $0.0300 | 0.00% | Final | 21 Oct 2019 |
| 27 Sep 2018 | $0.0200 | 0.00% | Final | 26 Oct 2018 |
| 28 Sep 2017 | $0.0000 | 0.00% | Final | 27 Oct 2017 |
| 01 Sep 2016 | $0.0100 | 0.00% | Final | 30 Sep 2016 |
EOL ASX Announcements
An announcement is considered as "Price Sensitive" if it is thought that it may have an impact on the price of the security.
| Date | Announcement | Price Sensitive? | Time | No. of Pages | File Size |
|---|---|---|---|---|---|
| YesNo |
About Energy One Ltd
Energy One Ltd. engages in the development and provision of software solutions to the electricity and gas sector. Its products include EnergyFlow, EOT, EnergyOffer, NemSight, pypIT, SimEnergy, enTrader, enPrice, enVoy. The firm offers consulting, managed, and software services. The company was founded on November 28, 1996 and is headquartered in North Sydney, Australia.
EOL Share Price History Data provided by Morningstar.
| Date | Close | Change | % Change | Volume | Open | High | Low |
|---|---|---|---|---|---|---|---|
| 13 Nov 2026 | $14.02 | $-0.15 | -1.06% | 5,053 | $14.30 | $14.30 | $13.92 |
| 12 Nov 2026 | $14.17 | $-0.13 | -0.91% | 220,807 | $14.10 | $14.35 | $13.99 |
| 11 Nov 2026 | $14.30 | $-0.07 | -0.49% | 12,148 | $14.19 | $14.43 | $14.00 |
| 10 Nov 2026 | $14.37 | $0.17 | 1.20% | 9,163 | $14.51 | $14.85 | $14.01 |
| 09 Nov 2026 | $14.20 | $0.11 | 0.78% | 41,005 | $14.08 | $14.64 | $13.86 |
| 06 Nov 2026 | $14.09 | $-0.79 | -5.31% | 17,121 | $15.00 | $15.00 | $14.05 |
| 05 Nov 2026 | $14.88 | $1.37 | 10.14% | 80,635 | $13.99 | $15.15 | $13.92 |
| 04 Nov 2026 | $13.51 | $-0.69 | -4.86% | 133,371 | $14.20 | $14.36 | $13.39 |
| 03 Nov 2026 | $14.20 | $-0.06 | -0.42% | 100,355 | $13.97 | $14.20 | $13.57 |
| 02 Nov 2026 | $14.26 | $-0.09 | -0.63% | 90,794 | $14.23 | $14.27 | $13.54 |
| 30 Oct 2026 | $14.35 | $0.05 | 0.35% | 15,025 | $14.90 | $14.90 | $14.07 |
| 29 Oct 2026 | $14.30 | $0.23 | 1.63% | 42,777 | $14.34 | $14.43 | $13.79 |
| 28 Oct 2026 | $14.07 | $-0.43 | -2.97% | 28,942 | $14.47 | $14.69 | $14.07 |
| 27 Oct 2026 | $14.50 | $-0.10 | -0.68% | 21,769 | $14.62 | $14.95 | $14.20 |
| 26 Oct 2026 | $14.60 | $0.80 | 5.80% | 33,578 | $13.54 | $14.65 | $13.54 |
| 23 Oct 2026 | $13.80 | $-0.20 | -1.43% | 46,454 | $14.02 | $14.02 | $13.49 |
| 22 Oct 2026 | $14.00 | $-0.27 | -1.89% | 23,421 | $14.20 | $14.89 | $13.94 |
| 21 Oct 2026 | $14.27 | $-0.43 | -2.93% | 8,667 | $14.50 | $14.77 | $14.11 |
| 20 Oct 2026 | $14.70 | $0.06 | 0.41% | 44,541 | $14.59 | $14.70 | $14.10 |
| 19 Oct 2026 | $14.64 | $-0.03 | -0.20% | 1,315 | $14.50 | $14.67 | $14.49 |
| 16 Oct 2026 | $14.67 | $0.01 | 0.07% | 16,343 | $14.89 | $14.89 | $14.44 |
| 15 Oct 2026 | $14.66 | $-0.23 | -1.54% | 21,357 | $14.89 | $14.89 | $14.33 |
Director Transactions Data provided by Morningstar.
| Date | Director | Type | Amount | Value | Notes |
|---|---|---|---|---|---|
| 02 Nov 2026 | Michael Ryan | Buy | 1,610 | $22,959 |
Conversion of securities. As per announcement, Nil consideration
|
| 02 Nov 2026 | Michael Ryan | Exercise | 1,610 | $22,959 |
Conversion of securities. Nil consideration, 6,570 share rights
|
| 30 Oct 2026 | Ben Tranier | Issued | 337,357 | $3,100,000 |
Issue of securities. Estimated value
|
| 30 Oct 2026 | Ian Ferrier | Issued | 3,569 | $50,566 |
Director remuneration. 3,569 share rights
|
| 30 Oct 2026 | Michael Ryan | Issued | 1,679 | $23,796 |
Director remuneration. 8,180 share rights, as per announcement
|
| 30 Oct 2026 | Richard Kimber | Issued | 3,569 | $50,566 |
Director remuneration. 3,569 share rights
|
| 27 Oct 2026 | Shaun Ankers | Sell | 37,121 | $528,231 |
On-market trade. average sale price of $14.23.
|
| 01 Jul 2026 | Shaun Ankers | Transfer | 4,828 | $51,997 |
Off-market transfer.
|
| 01 Jul 2026 | Shaun Ankers | Exercise | 243,625 | $969,627 |
Conversion of securities.
|
| 01 Jul 2026 | Shaun Ankers | Buy | 243,625 | $969,627 |
Conversion of securities.
|
| 01 Jul 2026 | Shaun Ankers | Transfer | 4,828 | $51,997 |
Off-market transfer.
|
| 05 Mar 2026 | Andrew Bonwick | Sell | 15,000 | $218,100 |
On-market trade.
|
| 27 Feb 2026 | Shaun Ankers | Sell | 17,000 | $260,270 |
As advised by the company. The 17,000 shares sold represents ~1.5%
of Mr. Ankers holdings and was carried out for personal reasons. |
| 01 Dec 2025 | Ian Ferrier | Sell | 326,039 | $5,379,643 |
As advised by the company. Sale of shares
|
Directors & Management Data provided by Morningstar.
| Name | Title | Start Date | Profile |
|---|---|---|---|
| Mr Ian Douglas Ferrier | Non-Executive Director | Nov 1996 |
Mr. Ferrier has over 40 years' experience in corporate recovery and turnaround practice. Mr. Ferrier is also a director of a number of private companies. He was the Chairman of Goodman Group Limited and retired on 19 November 2020. Mr. Ferrier is a member of the Risk committee.
|
| Mr Andrew Bonwick | Non-Executive DirectorNon-Executive Chairman | Oct 2006 |
Mr. Bonwick was the Marketing Director of Yallourn Energy for 6 years. His career has included roles in senior management, institutional equity research and management consulting. Mr. Bonwick is also a member of the Risk Committee.
|
| Mr Michael John(Joseph) Ryan | Non-Executive Director | Jan 2024 |
Mr. Ryan is an executive and director with capital markets experience. Throughout his 40 year career, Mr. Ryan has experienced in steering companies towards growth and turnarounds. He has held a number of positions across a range of industries, including executive and board roles at Goldman Sachs JBWere, Morgan Stanley, Citibank, CIMB, and Shaw and Partners. Mr. Ryan is Executive Chairman of Cann Group (CAN), Director of PM Capital Global Opportunities Fund (PGF), and a member of the Advisory Board of Centrestone Capital. He is also a member of the Risk Committee.
|
| Mr Shaun Ankers | Chief Executive OfficerManaging Director | Jun 2010 |
Mr. Ankers has more than 25 years' business experience, focused on the growth and development of technology businesses, including sales and marketing experience with utilities and clients. Mr. Ankers is also a member of the Risk Committee.
|
| Ms Leanne Theresa Graham | Non-Executive Director | Dec 2022 |
Ms. Byrne has over 30 years of experience in the software industry. As an entrepreneur and executive, she has been in multiple startups and global tech companies. She is also member of the Risk Committee.
|
| Mr Richard Kimber | Non-Executive Director | Mar 2024 |
Mr. Kimber is a Non-Executive Director and Chair with over 30 years of global leadership experience across financial services, technology, and digital transformation. He currently serves as Chair of Stone & Chalk, Chair of Lumi Financial Ltd. His Non-Executive Director roles include ING Bank Australia (Chair, Technology & Transformation Committee), VetPartners (Chair, Digital & Technology Committee) and Daisee, an AI software company he founded in 2017. Prior to his board career, Mr. Kimber was the inaugural Managing Director of Google in Southeast Asia. He was also Chief Executive of firstdirect Bank in the United Kingdom - regarded as the world's original neobank and held international roles within the HSBC Group.
|
| Mr Ben Tranier | Chief Executive OfficerExecutive Director | Mar 2026 |
Mr Tranier has more than 20 years' experience in energy trading software and services across Europe and Asia-Pacific. He has held leadership roles spanning product, commercial and regional management within global energy technology businesses, including his prior role as General Manager Europe within Energy One. He is also a member of the Risk Committee.
|
| Mr Erik Jean Corneel Vennekens | Non-Executive Director | Oct 2026 |
Mr Vennekens has experience in the European energy and infrastructure sector, with senior leadership responsibilities across asset management, project delivery and business transformation. At Fluxys, he has been involved in the development and delivery of strategic energy infrastructure, including natural gas, LNG, hydrogen and projects. His experience also encompasses digital transformation, governance and organisational leadership.
|
| Mr Jason Mabee | Company Secretary | Aug 2026 |
-
|
| Jason Mabee | Company Secretary |
-
|
Top Shareholders Data provided by Morningstar.
| Name | Shares | Capital |
|---|---|---|
| Citicorp Nominees Pty Limited | 7,626,321 | 24.02% |
| HSBC Custody Nominees (Australia) Limited | 3,154,792 | 9.94% |
| Sonpine Pty Limited | 2,387,335 | 7.52% |
| Polding Pty Ltd | 1,779,727 | 5.61% |
| Mr Vaughan Busby | 1,470,000 | 4.63% |
| UBS Nominees Pty Ltd | 1,315,172 | 4.14% |
| BNP Paribas Noms Pty Ltd | 1,069,865 | 3.37% |
| Warbont Nominees Pty Ltd | 941,818 | 2.97% |
| Graham Shaun Ankers | 813,688 | 2.56% |
| Rearden Group Pty Ltd | 577,500 | 1.82% |
| Gliocas Investments Pty Ltd | 484,582 | 1.53% |
| J P Morgan Nominees Australia Pty Limited | 477,854 | 1.51% |
| Ankers Super Fund Pty Ltd | 440,066 | 1.39% |
| Polding Pty Ltd i | 416,259 | 1.31% |
| Mr Jonathan James Tooth | 413,234 | 1.30% |
| Rearden Group Pty Ltd i | 409,486 | 1.29% |
| May James Consulting Pty Ltd | 399,180 | 1.26% |
| Mast Financial Pty Ltd | 391,204 | 1.23% |
| Abbysah Pty Limited | 337,243 | 1.06% |
| Mr Ottmar Weiss | 300,000 | 0.94% |