Australian Agricultural Co Ltd (ASX: AAC) Share Price and News
Price
Movement
(20 mins delayed)
52 Week Range
-
1 Year Return
Australian Agricultural Co Ltd Chart and Price Data
Fundamentals Data provided by Morningstar.
Data provided by Morningstar.Share Price
Day Change
52 Week Range
-
Yesterday's Close
Today's Open
Days Range
-
Volume
Avg. Volume (1 month)
Turnover
as at 24 Feb 3:44pm
Australian Agricultural Co Ltd (ASX: AAC)
Latest News

Share Market News
Here's how the ASX 200 market sectors stacked up last week

Share Market News
A boring ASX All Ords share offering an exciting 40% return

Share Gainers
3 ASX All Ords shares surging over 10% on Thursday

Dividend Investing
2 ASX dividend shares that could be very reliable

Share Market News
What ASX shares might be affected by the UK-Australia trade deal?
Consumer Staples & Discretionary Shares
Australian Agricultural Company (ASX:AAC) share price slips on full-year results
Share Market News
Will Aussie agricultural commodity prices see another record-breaking year?
Share Market News
Here's why the Australian Agricultural Company (ASX:ACC) share price is up 6% today
Resources Shares
New Chinese government threat leaves these ASX mining stocks on tenterhooks

Share Market News
ASX 200 ends the day higher, EML share price rises another 12%

Share Market News
Indonesian market boom for 6 ASX shares
⏸️ Investing
Your guide to the February ASX reporting season
Frequently Asked Questions
-
No, Australian Agricultural Co has not paid shareholder dividends in its recent history. Its last recorded shareholder dividend was an unfranked dividend payment in October 2008.
-
Australian Agricultural Co Ltd listed on the ASX on 10 August 2001.
Dividend Payment History Data provided by Morningstar.
| Ex-Date | Amount | Franking | Type | Payable |
|---|---|---|---|---|
| 14 Sep 2007 | $0.0490 | 0.00% | Final | 05 Oct 2007 |
| 14 Sep 2006 | $0.0490 | 0.00% | Interim | 16 Oct 2006 |
| 16 Sep 2005 | $0.0532 | 26.32% | Interim | 14 Oct 2005 |
| 23 Oct 2003 | $0.0400 | 100.00% | Final | 28 Nov 2003 |
AAC ASX Announcements
An announcement is considered as "Price Sensitive" if it is thought that it may have an impact on the price of the security.
| Date | Announcement | Price Sensitive? | Time | No. of Pages | File Size |
|---|---|---|---|---|---|
| YesNo |
About Australian Agricultural Co Ltd
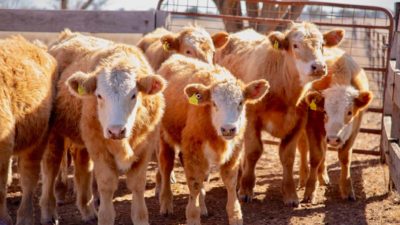
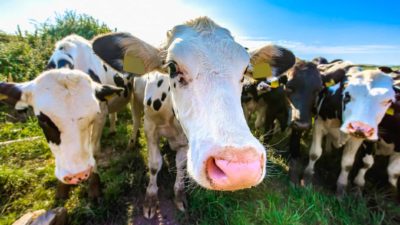
Australian Agricultural Co Ltd (ASX: AAC) raises cattle in Australia to process and export globally. It owns and operates Australia's largest beef herd — around 382,000 head — on its properties across 6.5 million hectares of land in Queensland and the Northern Territory. Its properties account for approximately 1% of Australia's land mass.
Established in 1824, Australian Agricultural Co Ltd counts itself as Australia's oldest continuously operating company. It specialises in both grass-fed and grain-fed beef, as well as Japanese-style wagyu beef. AACo distributes branded beef to a range of customers globally, tailoring its route-to-market model by country to capitalise on regional opportunities.
AACo invests in research and technologies in a bid to produce high-quality beef and improve productivity. The company says it has more opportunities for gathering data because its cattle are owned and monitored throughout the supply chain.
AAC Share Price History Data provided by Morningstar.
| Date | Close | Change | % Change | Volume | Open | High | Low |
|---|---|---|---|---|---|---|---|
| 17 Apr 2026 | $1.34 | $0.01 | 0.76% | 23,720 | $1.33 | $1.34 | $1.33 |
| 16 Apr 2026 | $1.32 | $0.00 | 0.00% | 157,015 | $1.33 | $1.35 | $1.32 |
| 15 Apr 2026 | $1.33 | $-0.01 | -0.75% | 78,826 | $1.34 | $1.35 | $1.33 |
| 14 Apr 2026 | $1.34 | $0.02 | 1.52% | 43,107 | $1.33 | $1.34 | $1.32 |
| 13 Apr 2026 | $1.32 | $-0.02 | -1.50% | 85,003 | $1.34 | $1.34 | $1.31 |
| 10 Apr 2026 | $1.33 | $0.01 | 0.75% | 46,606 | $1.35 | $1.35 | $1.31 |
| 09 Apr 2026 | $1.33 | $-0.02 | -1.49% | 18,471 | $1.35 | $1.35 | $1.33 |
| 08 Apr 2026 | $1.35 | $0.02 | 1.52% | 99,432 | $1.32 | $1.35 | $1.32 |
| 07 Apr 2026 | $1.32 | $0.00 | 0.00% | 37,436 | $1.32 | $1.33 | $1.32 |
| 02 Apr 2026 | $1.32 | $-0.02 | -1.49% | 39,315 | $1.34 | $1.34 | $1.31 |
| 01 Apr 2026 | $1.34 | $-0.01 | -0.74% | 90,608 | $1.35 | $1.35 | $1.29 |
| 31 Mar 2026 | $1.35 | $0.05 | 3.83% | 134,130 | $1.33 | $1.35 | $1.31 |
| 30 Mar 2026 | $1.31 | $-0.01 | -0.76% | 324,540 | $1.32 | $1.32 | $1.30 |
| 27 Mar 2026 | $1.32 | $-0.01 | -0.76% | 77,772 | $1.32 | $1.32 | $1.30 |
| 26 Mar 2026 | $1.32 | $0.00 | 0.00% | 42,935 | $1.32 | $1.32 | $1.31 |
| 25 Mar 2026 | $1.32 | $0.01 | 0.76% | 61,926 | $1.32 | $1.32 | $1.29 |
| 24 Mar 2026 | $1.32 | $0.03 | 2.33% | 132,643 | $1.29 | $1.32 | $1.29 |
| 23 Mar 2026 | $1.29 | $0.00 | 0.00% | 117,715 | $1.29 | $1.29 | $1.26 |
| 20 Mar 2026 | $1.28 | $-0.01 | -0.78% | 197,568 | $1.29 | $1.31 | $1.27 |
| 19 Mar 2026 | $1.29 | $-0.01 | -0.77% | 153,342 | $1.32 | $1.32 | $1.27 |
Director Transactions Data provided by Morningstar.
| Date | Director | Type | Amount | Value | Notes |
|---|---|---|---|---|---|
| 28 Nov 2025 | David Harris | Issued | 1,049,225 | $1,510,884 |
Issue of securities. 2,250,465 rights
|
| 04 Sep 2025 | David Harris | Issued | 111,879 | $159,986 |
Issue of securities. 1,201,240 Performance Rights
|
| 28 Aug 2025 | David Harris | Exercise | 50,188 | $71,517 |
Conversion of securities. 10,89,361 Rights
|
| 28 Aug 2025 | David Harris | Buy | 50,188 | $71,517 |
Conversion of securities.
|
| 26 Aug 2025 | David Harris | Exercise | 33,076 | $46,306 |
Conversion of securities. 11,39,549 Rights
|
| 26 Aug 2025 | David Harris | Buy | 33,076 | $46,306 |
Conversion of securities.
|
Directors & Management Data provided by Morningstar.
| Name | Title | Start Date | Profile |
|---|---|---|---|
| Mr Donald Gordon McGauchie | Non-Executive DirectorNon-Executive Chairman | May 2010 |
Mr McGauchie's previous roles with public companies include Chairman of Telstra Corporation Limited, Chairman of NuFarm, Deputy Chairman of James Hardie, Director of GrainCorp Limited, Deputy Chairman of Ridley Corporation Limited, Director of National Foods Limited, Chairman of Woolstock, Chairman of the Victorian Rural Finance Corporation, Chairman of the Australian Wool Testing Authority, President of the National Farmers Federation from 1994 to 1998 and Director of Reserve Bank of Australia from 2000 to 2011. In 2004 Mr McGauchie was appointed an Officer of the Order of Australia for services to the wool and grain industries.
|
| Mr Stuart Alexander Black | Non-Executive Director | Oct 2011 |
Mr Black has experience in agribusiness. He is a non-executive director of Noumi Limited, a former non-executive director of Palla Pharma Limited, NetComm Wireless Limited, Coffey International Limited, and Country Education Foundation of Australia Limited, former Chairman of the Chartered Accountants Benevolent Fund Limited. Mr Black is Chairman of the Risk Management Committee.
|
| Mr Anthony Abraham | Non-Executive Director | Sep 2014 |
Mr Abraham has over 30 years of experience in banking, finance and investment management, including 20 years specifically in food and agriculture. Mr Abraham established Macquarie Group's agricultural fund management business and is currently a member of ROC Partners' food and agricultural investment team. Mr Abraham is a member of the Risk Management Committee.
|
| Mr Marc Jonathan Blazer | Non-Executive Director | Jul 2019 |
Mr Blazer is currently the Chairman and CEO of Overture Holdings, a consumer, food & beverage, and hospitality investment group. He was the co-owner and Chairman of the Board of Noma Holdings, the parent company of world-renowned restaurant noma based in Copenhagen; co-founder and Executive Chairman of New York based PRIOR, a global hospitality and travel company; and co-founder and CEO of Boutique Life Inc, the parent company for Boutique, a vacation rental booking platform. In addition to his consumer and hospitality business activities, Mr Blazer has also had a career in capital markets. He was a partner and the global head of investment banking at Cantor Fitzgerald, on the advisory board of Enertech, and worked at ChaseMellon Financial Corp. Earlier in his career, Mr Blazer was an advisor to members of Congress in both the US House of Representatives and Senate on tax matters, banking and securities legislation, international trade policy, and foreign relations. He is Chairman of the Brand, Marketing & Sales Committee.
|
| Ms Sarah Gentry | Non-Executive Director | Oct 2022 |
Ms Gentry is a Vice President at the Tavistock Group where she manages investments in the food, agriculture, health and technology sectors. She has experience in finance, operations, investments and marketing. She is a member of the Risk and Management Committee and was appointed to the Brand, Marketing & Sales Committee on 13 May 2025.
|
| Mr David Harris | Chief Executive OfficerManaging Director | Sep 2022 |
Mr Harris has supply chain experience across various aspects of Australian agriculture. He has knowledge in the operation of large-scale animal production systems, having previously held executive positions with Stanbroke, Smithfield Cattle Co. and having run a private agricultural consultancy business and family farming operations in central west New South Wales.
|
| Mr Josh Levy | Non-Executive Director | Dec 2023 |
Mr Levy is Co-Chief Executive Officer of Tavistock Group, member of the Board of Directors and Executive Committee, where his responsibilities include investment strategy and portfolio management. He also serves as Chief Executive Officer of UK-headquartered specialist business lender, Ultimate Finance. Mr Levy has experience in food and hospitality serving as a non-executive Director of Mitchells & Butlers plc, a FTSE 250 group, and the UK's largest owner of managed pubs and restaurants, since 2015. Mr Levy began his career in UK mergers and acquisitions and has worked at Tavistock Group since 2016. Prior to joining Tavistock, Mr Levy worked in investment banking at Investec Bank plc specialising in UK mergers and acquisitions and equity capital markets. He is a member of the People and Culture Committee.
|
| Ms Nicole Tania Sparshott | Non-Executive Director | May 2025 |
Ms Sparshott is a Director with more than 30 years of consumer goods and retail experience. She has lived and worked across international markets, with time in Asia Pacific, UK, and Europe. Nicoles former Executive roles include Global Chief of Transformation for Unilever; CEO of Unilever Australia & New Zealand; Global CEO of luxury retailer, T2 Tea, and commercial roles spanning Asia Pacific. Nicole currently serves as the Chair of the NSW based University of Technologys Vice Chancellors Industry Advisory Board and is Non-Executive Director for the World Wildlife Fund. She was formerly a Non-Executive Director on the Australian Food & Grocery Council and Chair of Global Sisters. Nicole will also join the Brand Marketing and Sales Committee as a member of each.
|
| Ms Zoe Elizabeth Kenneally | Non-Executive Director | Dec 2025 |
Ms Kenneally has more than two decades of experience in finance, agribusiness and governance. Ms Kenneallys recent role was Managing Director of Assets at Laguna Bay Group, where she was responsible for the strategic management of a large portfolio of food and agriculture investments across Australia. Prior to that, she held executive and CFO roles at Laguna Bay and served as a Director at Ernst & Young for more than a decade, specialising in assurance, risk and regulatory compliance. Zoe is currently on the Board of the Queensland Rural and Industry Development Authority (QRIDA) Zoe will also join the Risk Management Committee.
|
| Ms Emily Bird | Company Secretary | Feb 2024 |
-
|
| A. O'Brien | Chief Commercial Officer |
-
|
|
| G. Steedman | Chief Financial Officer |
-
|
|
| Emily Bird | Company Secretary |
-
|
|
| J. Huntington | Executive General Manager - Corporate Services |
-
|
Top Shareholders Data provided by Morningstar.
| Name | Shares | Capital |
|---|---|---|
| HSBC Custody Nominees (Australia) Limited | 476,743,051 | 79.10% |
| Citicorp Nominees Pty Limited | 20,807,663 | 3.45% |
| J P Morgan Nominees Australia Pty Limited | 14,592,265 | 2.42% |
| Custodial Services Limited <Beneficiaries Holding A/C> | 6,633,504 | 1.10% |
| BNP Paribas Nominees Pty Ltd | 5,802,040 | 0.97% |
| Pacific Custodians Pty Limited | 5,634,147 | 0.94% |
| Quality Life Pty Ltd <The Neill Family A/C> | 2,754,981 | 0.46% |
| Mr Barry Martin Lambert | 1,177,660 | 0.20% |
| Rathvale Pty Limited | 953,482 | 0.16% |
| Mrs Joy Wilma Lillian Lambert | 921,702 | 0.15% |
| Mcgauchie Super Pty Ltd <Mcgauchie S/F A/C> | 771,416 | 0.13% |
| Mr Lenard James Norris | 700,000 | 0.12% |
| Wykala Pty Limited | 700,000 | 0.12% |
| Gladiator Securities Pty Ltd <Hayberry Global Fund A/C> | 685,200 | 0.11% |
| Netwealth Investments Limited <Wrap Services A/C> | 622,369 | 0.10% |
| Ace Property Holdings Pty Ltd | 600,000 | 0.10% |
| Trustum Investments Pty Ltd <Trustum Super Fund A/C> | 500,000 | 0.08% |
| Piama Pty Ltd <Fena Superannuation Plan A/C> | 500,000 | 0.08% |
| Crofton Park Developments Pty Ltd <Sam Brougham Family A/C> | 473,105 | 0.08% |
| Mr Bruce Macaulay Bennett | 454,807 | 0.08% |
