
This article was originally published on Fool.com. All figures quoted in US dollars unless otherwise stated.
In our prior dispatch, we learned that return on invested capital (ROIC) is the most important financial metric because:
- An increase in ROIC always increases intrinsic business value but revenue growth does not always increase intrinsic value. Revenue growth only increases intrinsic value when ROIC is greater than the weighted average cost of capital (WACC).
- Companies with high ROIC outperform the stock market by a country mile.
- And companies with rising ROIC (and high incremental returns on invested capital) outperform the market by even more!
Return on invested capital is calculated as net operating profit after tax (NOPAT) divided by average invested capital, so it has a robust profitability metric in the numerator and a balance sheet measure in the denominator. In this way, it is the linchpin that connects a company's profitability (income statement), balance sheet, and free cash flow (FCF).
And strong and growing free cash flow (particularly FCF per share) is ultimately what we are after as investors. As we stated (and repeated) in the linked article and are restating again now, businesses with higher ROIC generate more FCF per dollar of earnings, and growth of free cash flow is what drives growth of intrinsic value! In fact, the definition of intrinsic value (also referred to as fair or fundamental value) is the present value of future free cash flows. Fair value can also be thought of as the price you can pay for a stock and roughly earn your required rate of return (or hurdle rate in your discounted cash flow model).
The great Michael Mauboussin says (100% correctly, I might add) that all of the quantitative and qualitative work (due diligence) that we do as analysts serves one purpose and one job only: to help us estimate (with a high-enough degree of conviction) the free cash flows a company will generate from now until the end of the life of that business and then to compare our estimates for free cash flow growth to the expectations for free cash flow priced into the stock. Then, when we think the expectations for future free cash flow growth are too low, we buy the stock. And when we think the expectations for future free cash flow growth priced into the stock are too high (and even extreme and insane like we saw in 2020-2021), we can choose to trim or sell the stock.
That's it, Fools. All of the weeks and months (and sometimes years) of research and analysis that we do as investors is only so that we can make educated guesses about how much free cash flow the company will generate and at what rate that free cash flow will grow over the forecast period in our discounted cash flow models.
So, if everything boils down to free cash flow, it may come as no surprise that companies that generate high free cash flow margins (FCF divided by revenue) and companies that provide high free cash flow yields (FCF divided by enterprise value) also outperform the market by light-years.
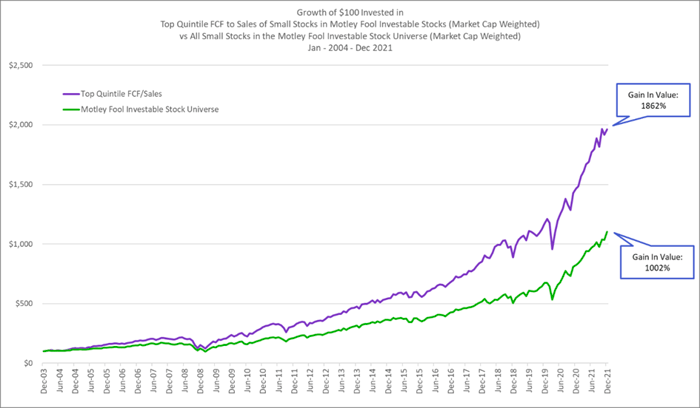
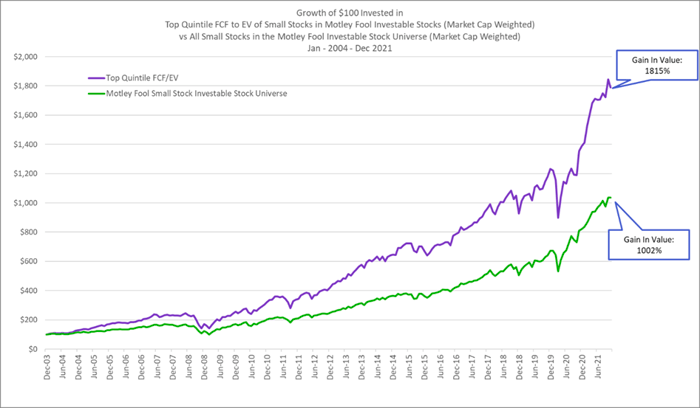
Free cash flow margin measures the true economic profitability and cash-generating power of a business and is simply the number of pennies of FCF a company generates for every dollar of sales. And free cash flow yield is the inverse of the enterprise value-to-FCF multiple. Thinking in terms of yield allows investors to compare a stock's FCF yield to the risk-free rate (the yield on the 10-year U.S. Treasury bond), to the yields of other stocks and bonds, and to the yields from investing in real estate (a real estate's cap rate is calculated as annual net cash flow divided by the purchase price of the property). All else being equal, whether you are dealing with stocks, bonds, or real estate, higher yields indicate cheaper purchase prices.
Here is how I like to think about free cash flow yield: a company's dividend yield is how much cash the company actually pays out as a dividend, but free cash flow yield is how much cash the company could potentially pay out as a dividend if it chose to pay out all excess free cash flow as a dividend. As Bill Miller told me: "Empirically, free cash flow yield is the most useful metric. If a company is earning above its cost of capital, free cash flow yield plus growth is a good rough proxy for expected annual return." Several of the world's best investors use this FCF total return formula (FCF yield + expected growth of FCF over the next 5 years) when picking stocks.
Said another way, FCF yield is the amount of cash (as a percentage of the firm value) a sole owner could take out of the business every year to pay themselves. This is the excess, unencumbered free cash that is left over after investing to maintain and grow the business, and it is calculated as NOPAT less new invested capital, where invested capital is any form of investment including working capital, capital expenditures (property, plant and equipment), or acquisitions. Research and development (R&D) and sales and marketing (S&M) is also subtracted out (accounted for) on the income statement to get NOPAT. So all growth investments are accounted for and free cash flow is what is left over to pay all claim holders after investing in paying all bills and growing the business. Hence, the term "free." To understand more on free cash flow, this article from Michael Mauboussin is a must-read.
This free cash flow is what we care most about because it can be used to reward shareowners by either (1) paying down debt (which reduces the claim that debtholders have on the business and strengthens the company's financial position), (2) paying a dividend, or (3) buying back stock at attractive prices. Then any leftover free cash that isn't used to pay down debt, pay a dividend, or repurchase stock can sit on the balance sheet and be used at a later date (i.e., large cash and net cash positions create optionality value).
So, now that you know that companies with high and/or rising ROIC and strong and growing FCF selling at attractive prices outperform the market, why would you not focus your largest positions on companies that have high and/or rising ROIC with high and/or rising FCF margins selling at high FCF yields?
I've said it at least 100 times and I'm going to say it again: Strong free cash flow generation, a long runway of free cash flow growth, and the price we pay for it is really all that matters to long-term investing success. If you want to live the free cash flow way, read Expectations Investing by Michael Mauboussin and Al Rappaport. It's the best investing book I've ever read, and it could change your life. This is the way to investing nirvana, Fools.
This article was originally published on Fool.com. All figures quoted in US dollars unless otherwise stated.